
New year, new me! I think they say that.
Anyhoo, there’s been a lot of discussion of macros in the last year, with me going on about the redox advantages of carbohydrates and that studies in mice show that branched-chain amino acid restriction reverses obesity. So I thought I’d start the year by putting fresh eyes on the historical data that we have on how macros have changed over time. To my knowledge no one has broken down the old USDA publications into macros all the way down to starch, sugar, SFA, MUFA, PUFA, BCAA.
I made this table based on a handful of publications by the USDA. These numbers are my best estimations based on the data presented by the USDA in these publications. The USDA has long defined one “nutrition unit” as a 25 year old male. I’m just the messenger. This table represents what would have been consumed by one nutrition unit. You can more or less ignore the calories in the sense of “did people eat more or less”. They are pulled from different studies using different methodologies and you probably can’t compare them. What I am interested in is changes in macronutrient composition as a percentage of calories and for that you need calories.
What I DO think these publications can tell us is trends in macronutrients over time. After the table I’ll present the relevant bits of the publications. The 1917 column isn’t “real” (which is why it’s greyed out), it’s the earliest suggested diet published by the USDA. It’s the first food pyramid.
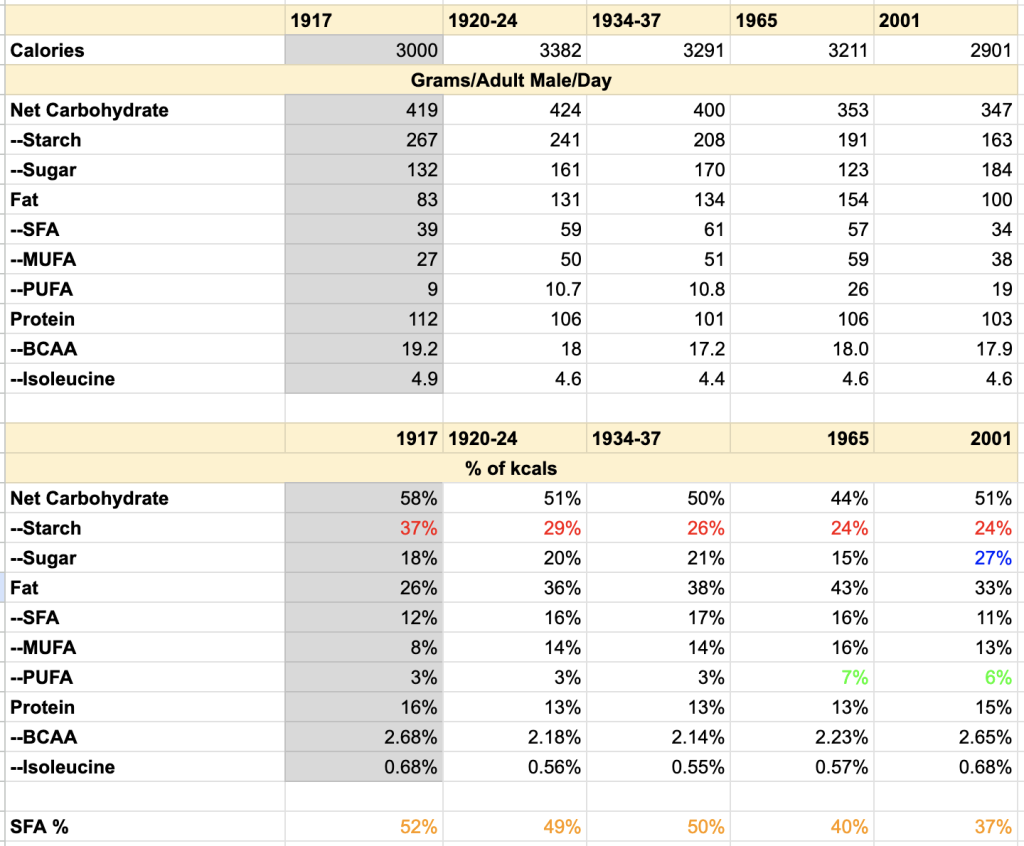
The first table shows macros as grams consumed per day per nutrition unit. Take the absolute numbers with a grain of salt. This is the raw data I used to generate the second table, which I have more confidence in. Macronutrient trends. Percent of calories by macronutrient over the last century. The percentages don’t sum to 100 because I’m using “net carbohydrates”, so fiber isn’t counted as a calorie.
Let’s see the numbers!
Notable Trends
Highlighted in red, you can see that starch has declined continuously. The recommendation was 37% of calories in 1917, the actuality was 29% of calories in 1920 dropping to 24% of calories in 2001. I’m a fan of starch, I’d argue this is going in the wrong direction.
Highlighted in green, you can see the uptick in polyunsaturated fat after the war. Early USDA publications barely acknowledge the existence of vegetable oil and margarine. Although they DID exist. Before 1940 the main sources of fat were dairy, beef and pork (lard). Much of the lard may have been adulterated with cottonseed oil. But who’s counting?
Highlighted in orange: fat become much less saturated in general. Through 1937, the fat Americans consumed was about half saturated. This dropped to 40% by 1965 and 37% by 2000. This is partially due to a rise in liquid oils, but also due to things such as poultry fat (30% saturated) replacing butter (70% saturated).
Highlighted in blue: Americans have always eaten a lot of sugar but the rise of soft drinks has pushed this even higher in the modern era. Much of this is now high fructose corn syrup.
Protein: There is an apparent small uptick in protein in the modern era (post 2000). This is only true in a percentage of calories way. It’s not clear to me that this is real. If it IS real, it’s because chicken.
The Publications
The first is “How To Select Foods” by Caroline L. Hunt and Helen W. Atwater. It was released by the USDA in 1917. I’ve added a menu item called “What We Ate” so that you can easily find these historical publications. This is the first published dietary recommendation from the USDA. The food pyramid of it’s time. This is their description of the food needed for a man who “like a salesman in a store, walks about more or less and does more or less of such work as lifting.”
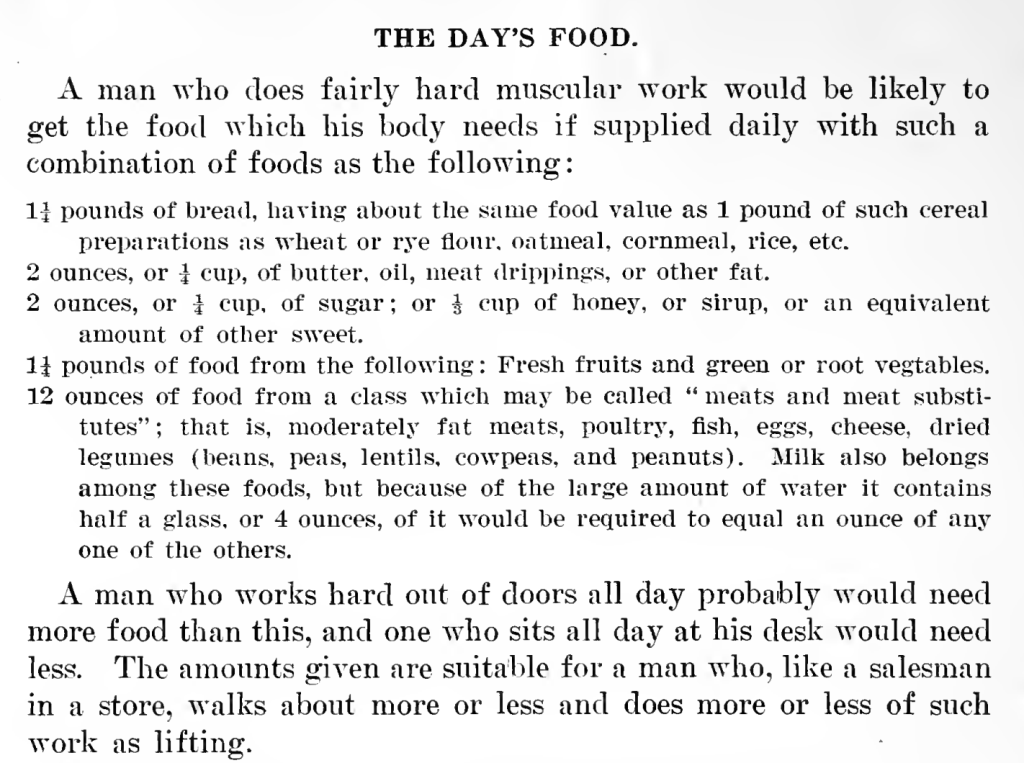
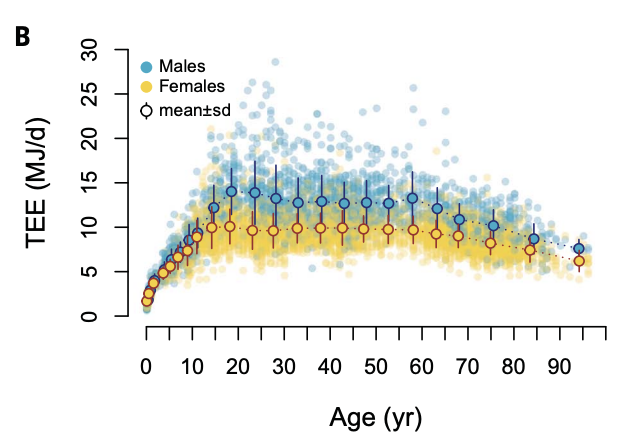
This diet would provide around 350g of starch – close to half of the calories in a 3000 calorie per day diet. By the way, most men burn about 3000 calories per day. This is from Pontzer et al published in Science in 2022. 12.5 Mj = ~3000 kcal.
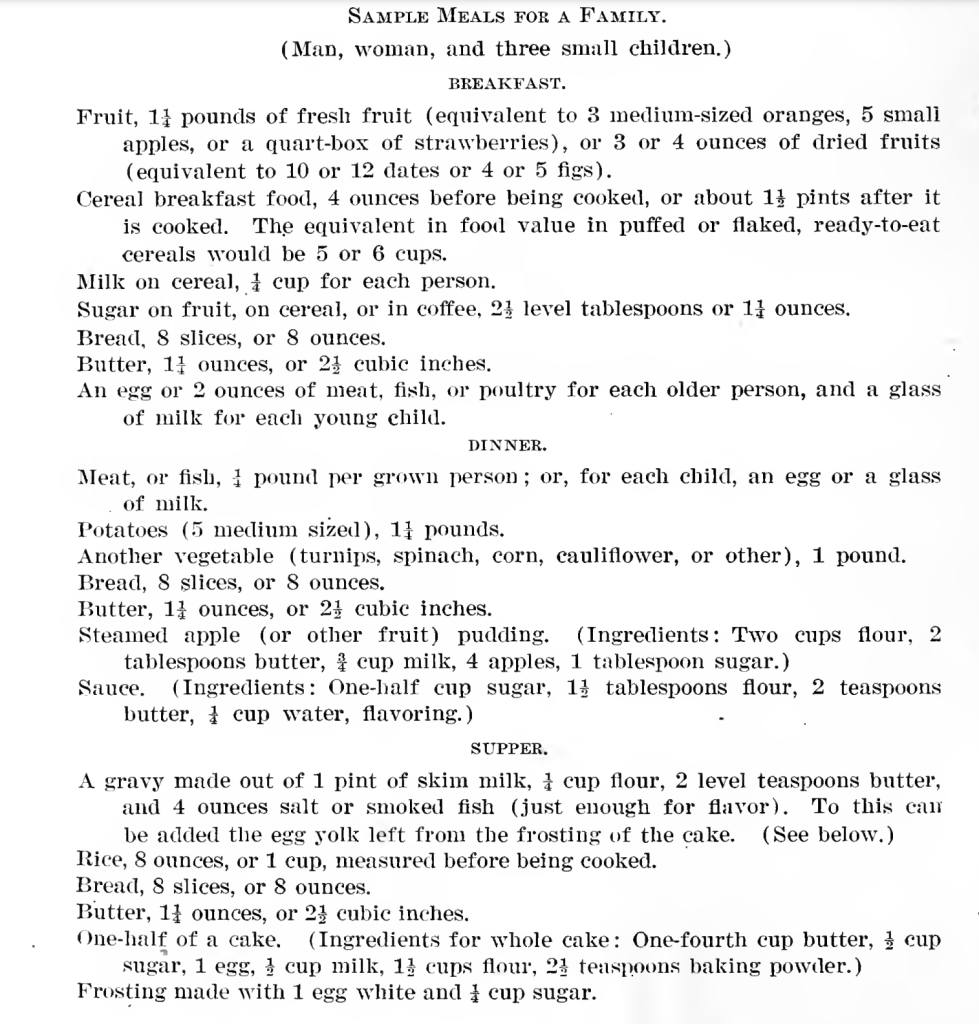
I didn’t use THAT diet as the recommendation from 1917 (the greyed out column in my table), I used the example daily menu scaled to provide 3000 calories. Dessert is served at both dinner and supper!!
1920s and 1930s
I used “Present Day Diets In The US” by Hazel K. Stiebeling and Callie Mae Coons to calculate actual diets (as opposed to recommended) between 1920 and 1937. This is columns two and three of my table. Much of the data is from this table:
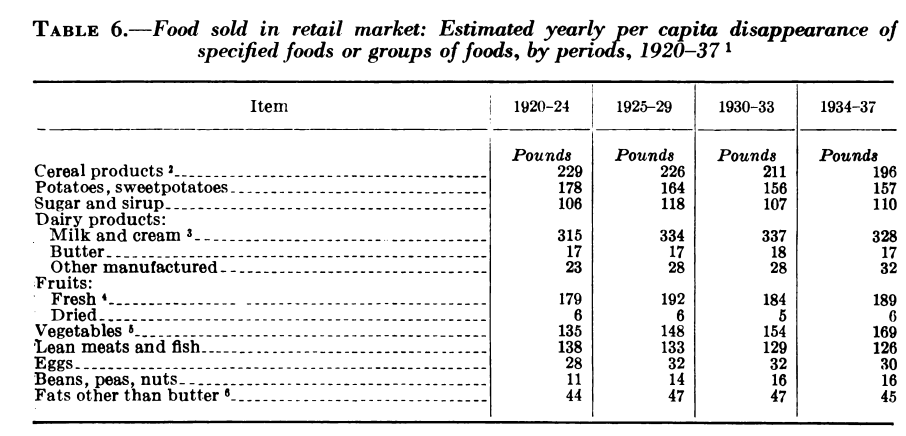
Assuming most of this was consumed, the average American in 1920 ate about 10 ounces of grain; 8 ounces of potatoes; 4.5 ounces of sugar; nearly a pint of whole milk; 2.5 ounces of fat from butter, lard and margarine; two thirds of an egg; and 6 ounces each of meat and vegetables. Over this time period grain, meat and potato consumption dropped slightly and were replaced by cheese, ice cream and legumes (peanut butter, baked beans).
1965
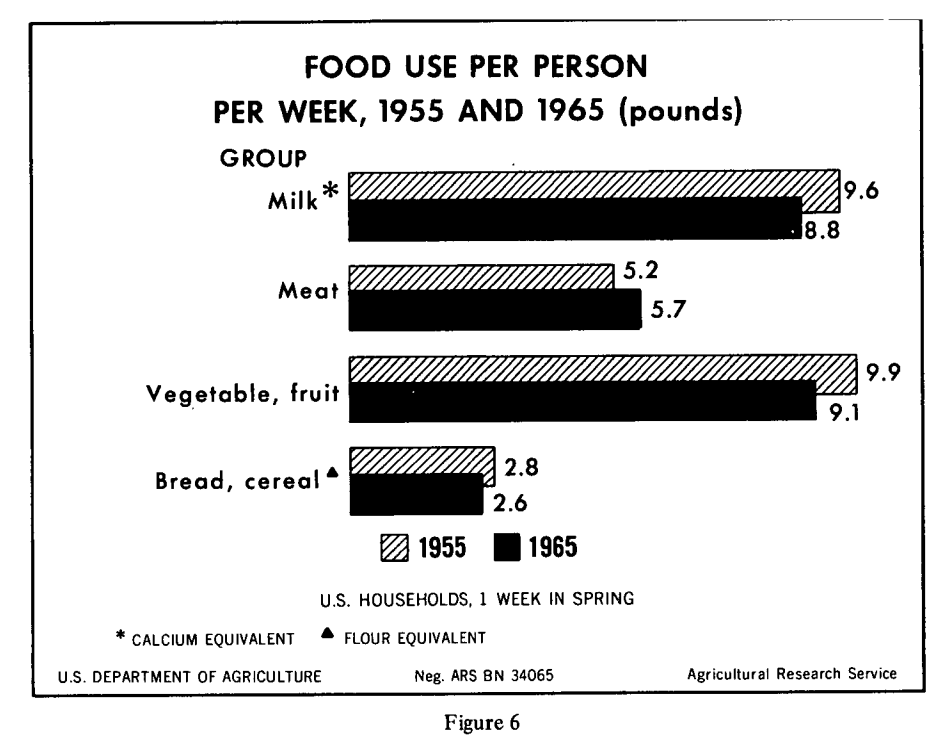
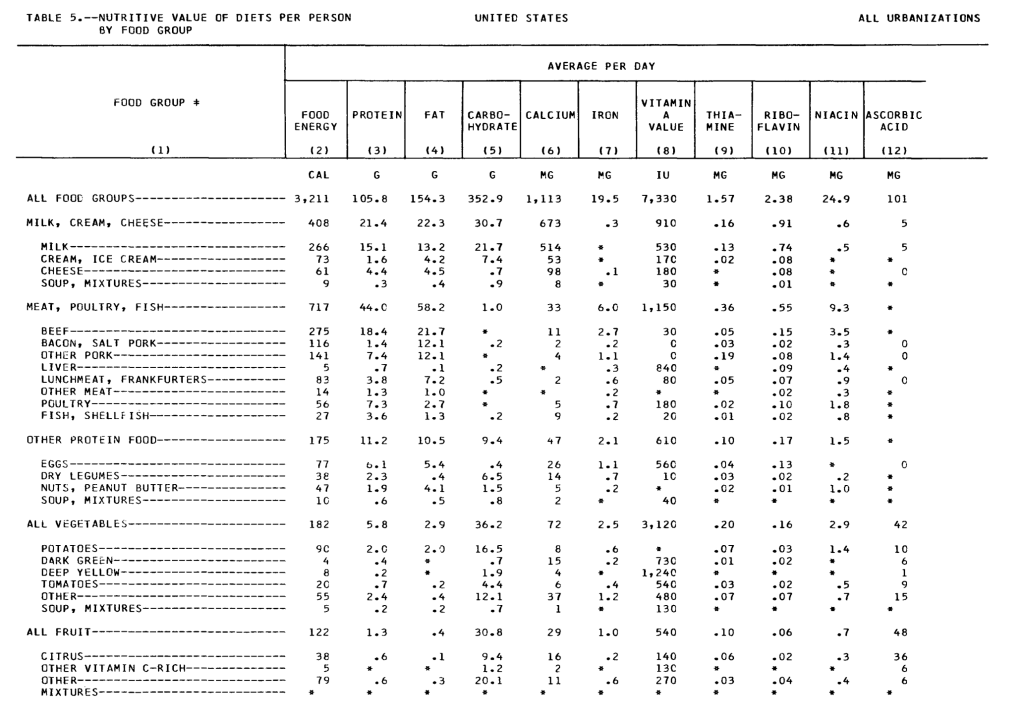
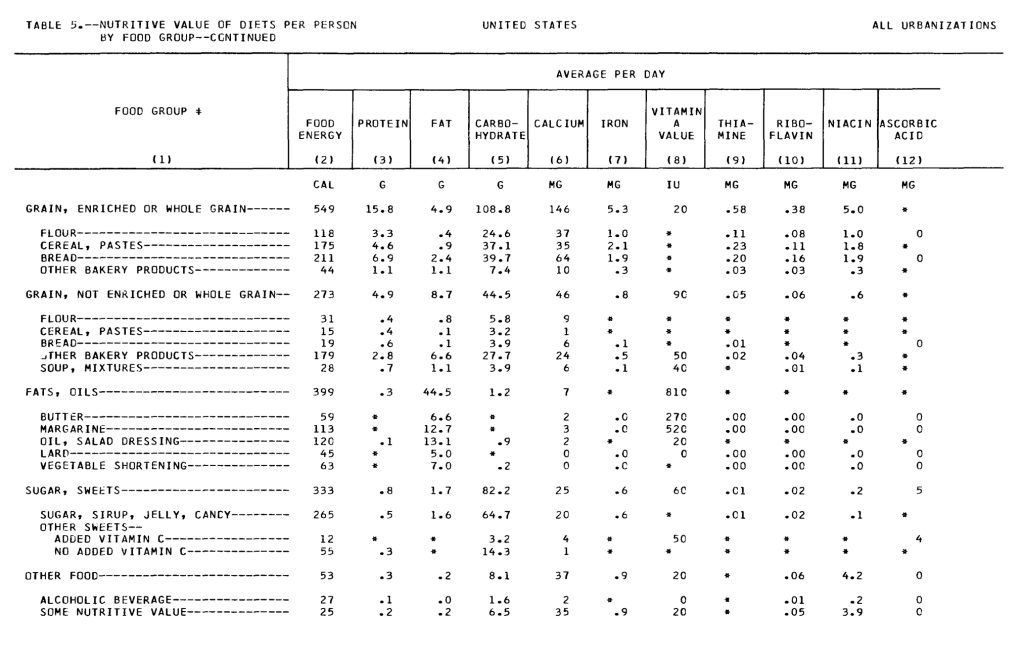
The next publication is “Dietary Levels Of Households In The United States, Spring 1965” by the USDA ARS. Milk consumption was higher (but lower compared to 1955), grains (6 ounces per day) and potatoes (vegetables) continued their decline. This was the post-war economic boom and meat (13 ounces), milk (20 ounces) and fat consumption were on the rise, replacing starch. This was the peak time of calories from fat and coincided with the early messaging to replace solid fats with liquid fats because of the supposed benefits to arterial health.
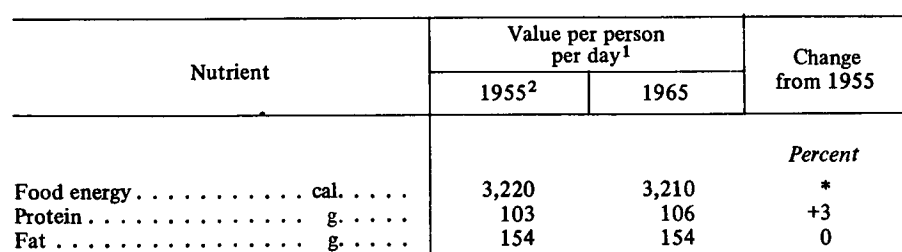
The numbers used in my 1965 column are from the following tables. You can see that margarine, oil and vegetable shortening now have their own listings. I used all-purpose flour to represent grains and 70/30 ground beef to represent all meats. My goal here is not hyper-accuracy (which is impossible anyway), it is to spot high level trends. My calculations from these tables actually came out lower in fat (~130g) than the number reported by the USDA in the previous table. I’ve adjusted my numbers up to match their analysis because they were there.
Modern Times
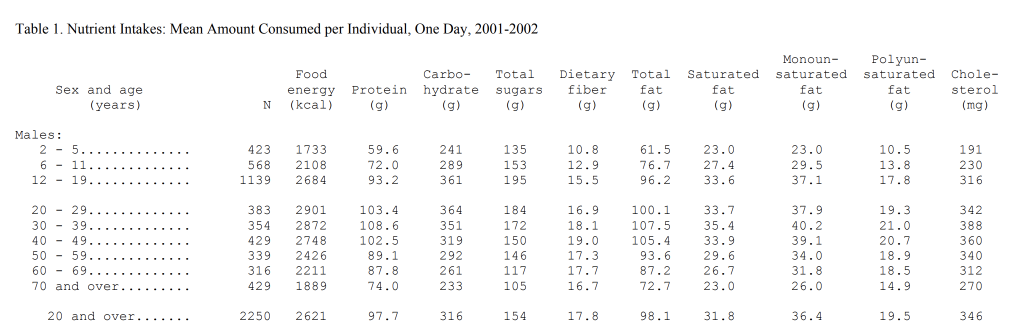
The final column is taken from the 2001 NHANES. I’ve used 20-29 year old males for the comparison since (as I mentioned) the USDA reports their number in “per nutrition unit” which they define as a 25 year old male. Not my idea. There are a lot of problems with NHANES. I doubt that a nutrition unit was consuming 300 calories less in 2001 than on in 1965. On the other hand, metabolic rates have dropped, so maybe? I still think NHANES is our best guess of how trends have changed from a very zoomed out perspective.
Fat is now VERY unsaturated and a lower percentage of calories. Starch consumption has continued to dropped into modern times and both have been replaced with sugar, much of which is now consumed as high fructose corn syrup. Americans always liked sugar, of course. They ate it with breakfast, dinner and supper.
Conclusions
In the early 20th century, the American diet was based on cheap staples: white flour, cornmeal, sugar, rice, oats, potatoes. This was supplemented with as much milk, eggs, meat and vegetables as could be afforded. As America became wealthier, the amount of meat, dairy and fat increased at the expense of grain and potatoes. Dietary recommendations beginning in the 1950’s drove trends towards increasingly unsaturated fat and lower fat items. Americans replaced the fat with soft drinks.
We know this story, more or less, but it’s still nice to look at the historical documents and confirm our storyline now and again.
Pontzer, H., Yamada, Y., Sagayama, H., Ainslie, P. N., Andersen, L. F., Anderson, L. J., Arab, L., Baddou, I., Bedu-Addo, K., Blaak, E. E., Blanc, S., Bonomi, A. G., Bouten, C. V. C., Bovet, P., Buchowski, M. S., Butte, N. F., Camps, S. G., Close, G. L., … Cooper, J. A. (2021). Daily energy expenditure through the human life course. In Science (Vol. 373, Issue 6556, pp. 808–812). American Association for the Advancement of Science (AAAS). https://doi.org/10.1126/science.abe5017