OR: An Ode To Vitamin K2
Summary
It is still something of a mystery why heart disease rates in America climbed precipitously in the first half of the 20th century and then steadily declined from 1960 on. The single best predictor of heart disease deaths is arterial calcium. The dietary factor that most affects arterial calcium is vitamin K2, which prevents calcium from being deposited in arteries. I propose that the reason for the increase in heart disease rates leading up to 1960 was a drop in dietary vitamin K2 consumption due to increasing urbanization followed by wartime butter rationing and the introduction of cheap margarine. I propose that the reason for the drop in heart disease deaths after 1960 was that vitamin K2 levels rapidly rebounded due to the invention of a water soluble form of vitamin K3 that was added to poultry rations beginning in the late fifties and pig rations in the late seventies, the advance of the processed food industry and therefore huge increase in cheese consumption and the massive increase in soybean oil consumption, a little discussed vitamin K powerhouse.
Introduction
As a former low-PUFA pork farmer and butcher, chef, and current blogger and inventor of The Croissant Diet, I have spent my adult life promoting saturated fat. This is some irony here. My father was a rural veterinarian and our income came in large part from local dairy farms. We ate margarine and cooked with vegetable oil when we used any oil at all, but mostly we stuck to the low fat paradigm of the 1980s and 1990s. We avoided fat in general but especially the “artery clogging saturated fat” that was at the center of our economic well-being.
My training at The French Culinary Institute and later discovery of Weston A Price’s “Nutrition and Physical Degeneration” changed my mind on the saturated fat topic. I consider the issued have been settled scientifically with George V. Mann’s scintillating review in the Sept 22, 1977 issue of the New England Journal of Medicine. I had just turned two years old when it was published. Everything he said rings just as true now.
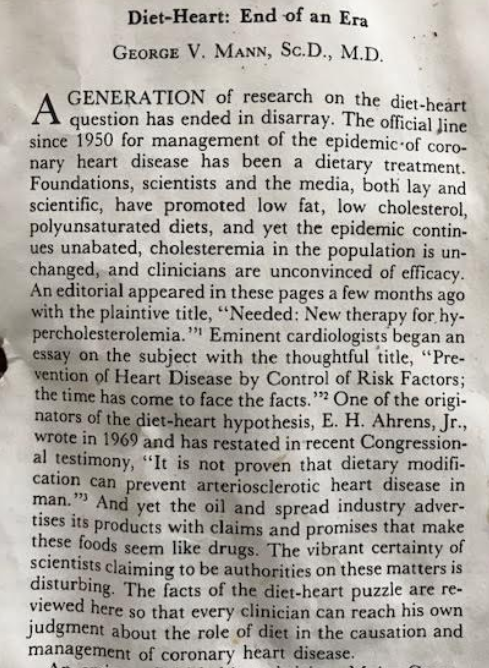
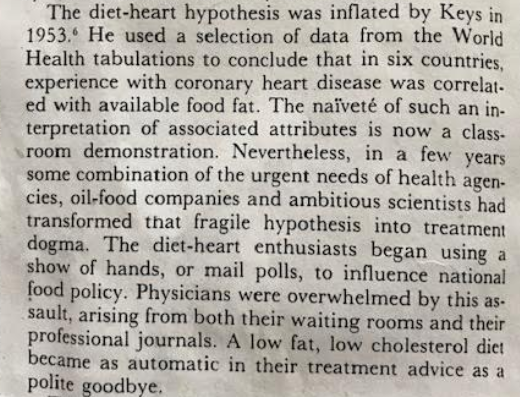
Despite my feelings on the issue, I am frequently asked, “Won’t saturated fat give me a heart attack?” I usually argue that the lowest rates of heart disease outside of Japan are in Western European countries like France, Italy and Switzerland where the diet is very high in dairy, beef and pork fat.
Nonetheless, here in the US, heart disease rates peaked in the early sixties, not long after Ancel Keys recommended highly unsaturated oils like corn oil and soybean oil to prevent heart disease. Soybean oil consumption exploded between 1960 and 2010. The “statin” cholesterol lowering drugs came to market: Lipitor and the others. Surgical inventions like stents were developed to hold open clogged arteries. Heart Disease death rates plunged.
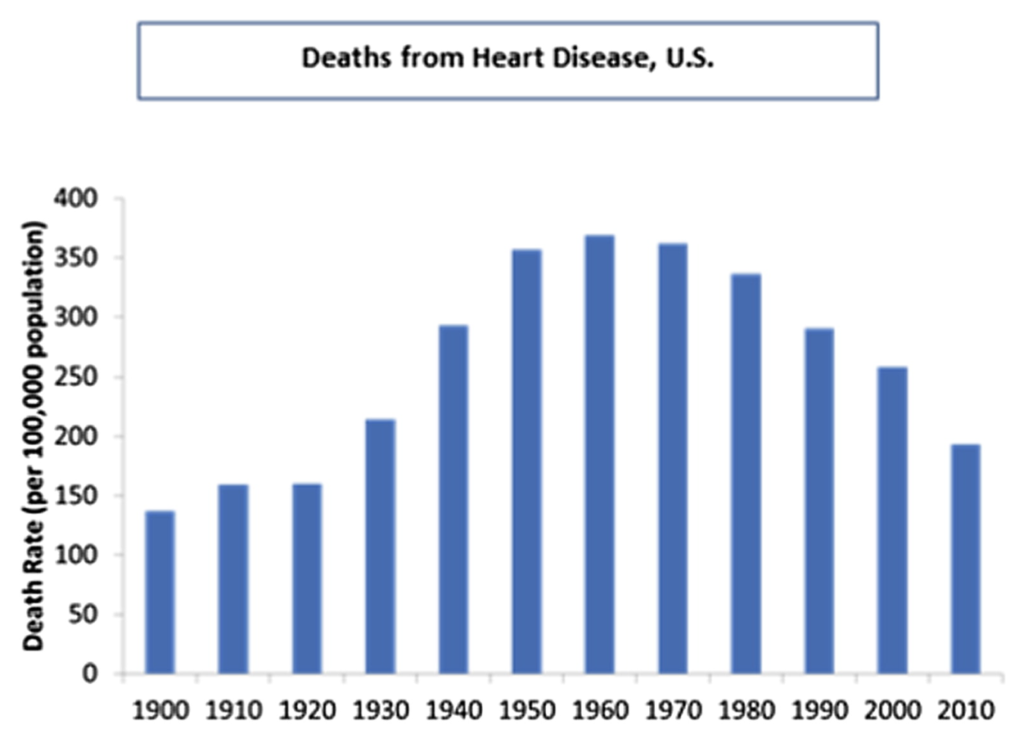
Certainly the increased proportion of polyunsaturated fat in the diet, lowered cholesterol due to statin drugs and aggressive medical interventions through stents explain the fall in rates from 1960 to 2010? The truth is a lot of science has been done on this topic and nothing in the literature suggests that these three interventions could achieve anything close to a 50% reduction in death rate.
Consider that in patients with known heart disease, 83 patients have to take a statin for 5 years for a single life to be saved and that no mortality benefit to cholesterol lowering has been demonstrated in patients without pre-existing heart disease. A recent Stanford and NYU study concluded, “Stents, bypass surgery show no benefit in heart disease mortality rates among stable patients”. And as to the polyunsaturated fat, Ramsden et al recently reviewed all of the known randomized controlled trials of substituting polyunsaturated fats for saturated fats. They found that, ” In meta-analyses, these cholesterol lowering interventions showed no evidence of benefit on mortality from coronary heart disease (1.13, 0.83 to 1.54) or all cause mortality (1.07, 0.90 to 1.27).”
Is it possible that three ineffective approaches to combating heart disease somehow synergized to be massively effective? I personally doubt it.
Arterial Calcium
In the first eighteen minutes of this great YouTube video, Ivor Cummins argues that a CAC (coronary artery calcium) scan is BY FAR the best predictor of heart disease.
If you don’t want to watch the video I will summarize his points:
- CAC scan shows actual heart disease progression
- If you have a score of 1000, you are 20 times more likely to die of a heart attack in the next ten years compared to a score below 10
- Compared to Coronary Calcium, smoking is a very small risk factor for heart disease
- People with a low CAC score get ZERO BENEFIT from cholesterol lowering statin drugs
- People with High CAC scores, the highest risk people, don’t have higher “Bad Cholesterol” than patients with a low score
- Insulin levels are a highly accurate predictor of who will have a second heart attack after a first
- The root cause of heart disease is “hyperinsulinemia” AKA Metabolic Syndrome
Let’s put Ivor’s last point into context. If he is correct that metabolic syndrome is a major driver of heart disease deaths, then what we SHOULD have seen over the past 50 years is a massive climb in heart disease rates as obesity/diebetes/metabolic syndrome rates skyrocketed. Instead rates plummeted.
This presents a paradox.
Is there a dietary or lifestyle factor that could explain such a divergence in trends? If arterial calcification is at the root cause of heart disease, let’s consider calcium. Most of us know that vitamin D is required for “strong bones and teeth”. But way back in the 1930’s, Weston Price showed that Vitamin D and calcium were ineffective in remineralizing bones without a third factor that he called “Activator X”. Much more recently, Chris Masterjohn argued that Dr. Price’s activator X is actually vitamin K2.
Among vitamin K2’s functions in the body is the activation of two proteins, osteocalcin and matrix GLA protein. Simply put, osteocalcin directs calcium into your bones and matrix GLA protein keeps it out of your arteries. Low vitamin K2 status is associated with increased arterial calcium. In the Netherlands, the highest dietary intake of K2 was associated with a massively 57% lower risk of Coronary Heart Disease and a 52% reduced risk of severe aortic calcification.
So we have a potential mechanism by which K2 prevents heart disease – the activation of matrix GLA protein which prevents arterial calcification. But what would have caused dietary vitamin K levels to plunge during the first half of the 20th century and then rebound dramatically in the following 60 years? This is a mystery involving socio-economic trends, changes in agriculture practices and advances in food processing technologies and the American diet. Sometimes these changes were deleterious and sometimes they were beneficial, but either way there was typically little discussion along the way of how behind the scenes changes would affect the health of the average person.
What are the Food Sources of Vitamin K2?
Traditionally, the highest source of Vitamin K2 in the American diet was dairy fat. Weston A Price found the butter from cows grazing rapidly growing grass in the spring had the highest levels of K2. All ruminant fat is a source of K2, but dairy fat is the richest.
Fermented foods also have a lot of vitamin K2 that is created by the bacteria during fermentation. This is a different form of K2, referred to as mk-7, as opposed to the mk-4 found in beef fat and fresh cream. Hard cheeses are the richest form of vitamin K2 mk-7 in the American diet. Fermented foods such as yogurt, sauerkraut and hard salami are also sources of mk-7.
Pork is an excellent source of the very long chain forms of vitamin K2 – mk-10 and mk-11. They get these from a process known as “copraphagy” – they eat their own poop – which is high in K2 due to fermentation in their large intestine. I’ve raised a lot of pigs. They DO eat their own poop. They are charming animals. Really.
We will come back to the subject of K2 mk-4 in pork and chicken.
What Caused the Drop in Vitamin K2 Leading Up To 1930?
The biggest reason for the drop was socio-economic: people were moving from the country to the city in massive numbers in the late 1800s and early 1900s. According to the Urbanization in the United States Wikipedia page, the percentage of Americans living in urban areas doubled between 1880 and 1930.
| Year | % Living in Urban Area |
| 1880 | 28.2% |
| 1890 | 35.1% |
| 1900 | 39.6% |
| 1910 | 45.6% |
| 1920 | 51.2% |
| 1930 | 56.1% |
In The French Diet In Upstate New York I calculated the average consumption of dairy fat of people living on fams to be AT LEAST 105 lbs per year in the late 1930s. This USDA publication from 1939 shows that farms were selling 1.7 billion lbs of butterfat in fresh milk, 1.1 billion lbs of butterfat in fresh cream and 0.06 billion lbs of pre-churned butter to the 74 million urban dwellers in 1939. This comes out to be around 39 lbs of butterfat per year. So urban dwellers, the easy majority of the country, were eating 60% less butterfat than their parents and grandparents as the heart disease epidemic started.
The second thing that affected k2 levels was a change in food processing technology. It is easier to separate the butter from the cream once the cream has soured. Farm produced butter was always made from soured cream. The fermentation of the cream would have contributed significant K2 mk-7 to farm produced butter. Incidentally, you can still buy “cultured butter” in the US if you know where to look, this is equivalent to the old farm produced butter. By the 1930s the vast majority of butter was being produced at regional creameries that were mechanically driven. It was more efficient to pick the fresh cream up from farms every morning and make it directly into sweet cream butter. So in addition to eating less butterfat, urban dwellers would have been eating sweet cream butter with a lower K2 mk-7 content.
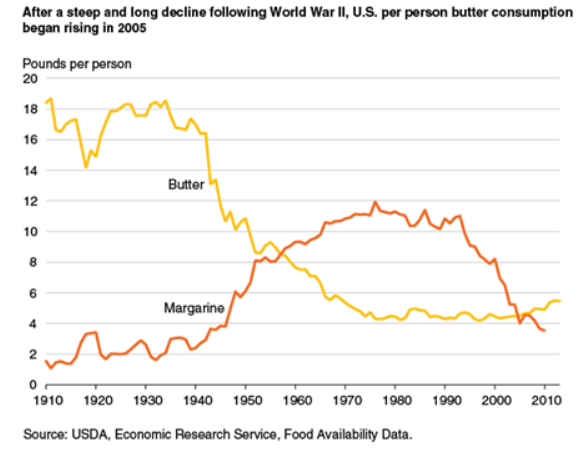
The final change was both geopolitical and economic. World War II brought about butter rationing. Butter was rapidly replaced by cheaper margarine. Dairy fat consumption plunged and heart disease rates exploded between 1940 and 1960.
A Reversal In Trends
By 1961 – the height of the epidemic, according to FAOSTAT, per capita dairy fat consumption was all the way down to around 22 lbs per year, down over 40% from 1940 and down around 80% from farm consumption. By this time the medical establishment had quizzically all gotten on board with the notion that the primary factor driving the epidemic was too much saturated fat. People started eating soybean oil and heart disease rates dropped.
What happened?! Changes in animal science and food processing technologies rapidly returned vitamin k2 to the American diet and, GASP, even soybean oil might have played a role. The doctors stumbled their way into prescience because even a broken clock is right twice a day. (For those of you below the age of 20, clocks used to have two hands that would spin around to tell the time. When a clock died the hands would stay in the same position all day. You can still see clocks like this on some churches and public monuments.)
The Broiler Industry
Chicken wasn’t commonly eaten before the 1950s. Chickens were traditionally scrawny, slow growing birds that took over 4 months to mature and produced a chewy meat that was best slow braised and shredded, hence the phrase “a chicken in every pot”. As opposed to a chicken in every oven or every skillet. I will turn to my trusty old copy of Wayne Rasmussen’s “Agriculture in the US: A Documentary History” to tell the story. I apologize for the grainy pics, I’ll try to replace them with something better.


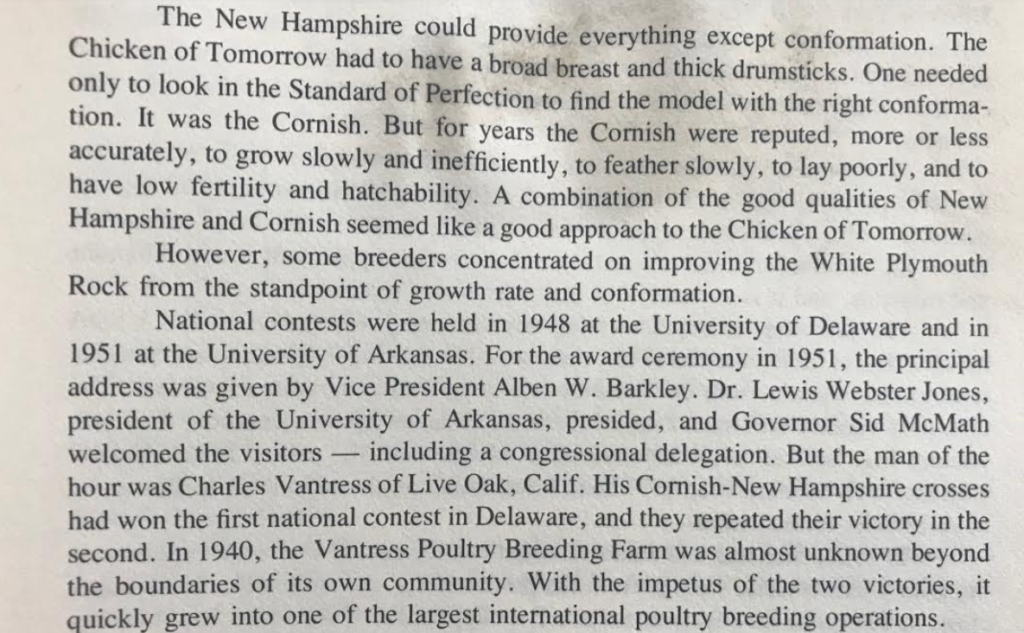
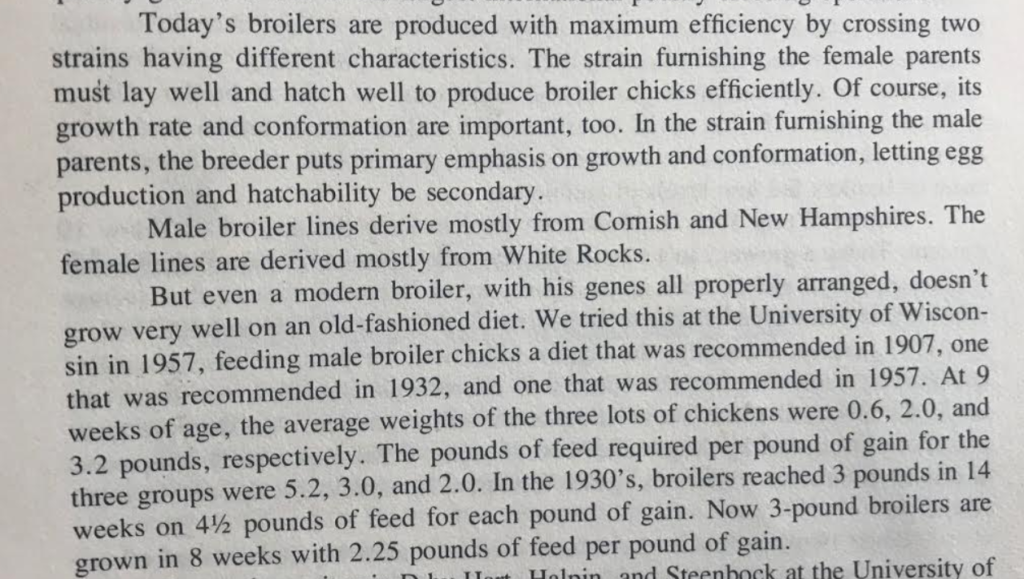
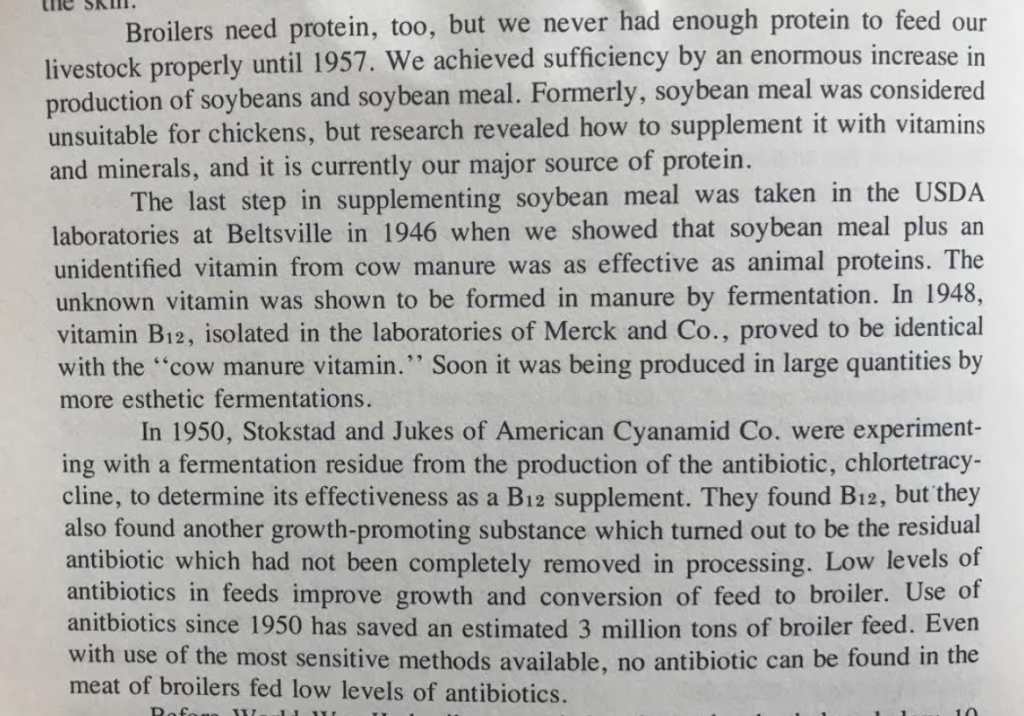
In a nutshell, that is the story of how modern chicken was created. Breeders realized that the best way to create consistent, fast growing plump birds was to create two different breeds and cross them to create a hybrid. Then they realized that to make birds grow fast enough they needed soy protein. Something was still missing that all only cow poop could provide. That’s how vitamin b12 was discovered. And then they found that the chickens grew faster if you fed them a steady stream of antibiotics! Lovely.
An issue faced by the industry as they rebuilt the chicken was hemorrhagic disease – bleeding to death. This was a major problem and it was realized at the time that vitamin K1 was crucial for blood coagulation. Vitamin K is, however, a fat soluble vitamin and in a low fat chicken feed it was hard to get the birds to absorb enough vitamin K.
The problem of absorbing fat soluble vitamins, incidentally, isn’t unique to chickens. A 1996 study in humans found that, compared to a pharmaceutical preparation, vitamin K was absorbed only 13% as well from spinach cooked in butter and only 4% as well from boiled spinach.
The solution to the hemorrhagic disease was found in the mid 1950s. Scientists discovered that they could make a water soluble version of vitamin K3, menadione. This water soluble vitamin k behaves very differently from the fat soluble form. It is easily absorbed and transported through the blood and is taken up by all (most?) tissues. Chickens can turn it into either vitamin K1 or vitamin K2. Chicken meat has in recent years consistently tested to have higher vitamin K2 content than beef and according to Innovix Labs , chicken thighs have a whopping 60 micrgrams of K2 per quarter lb portion. That’s a lot!
So in the late fifties, while chicken consumption was exploding, chicken went from being essentially a non-source of vitamin K2 to an excellent source of vitamin K2 overnight. Right before the heart disease epidemic peaked.
| Hi-K2 Chicken (cal/day) | Hi-K2 Pork (cal/day) | |
| 1961 | 64 | 0 |
| 1971 | 85 | 0 |
| 1981 | 108 | 136 |
| 1991 | 160 | 127 |
| 2001 | 187 | 129 |
| 2011 | 202 | 118 |
Ultimately, the same supplement was given to hogs. The first literature reference I can find is from 1976. So by the early 1980’s pork suddenly became a much better source of K2, just as chicken had in the late fifties.
Cheese
Here is the rare example of increased processed foods changing the diet in a good way. According to the USDA, cheese consumption rose dramatically over the second half of the 20th century due to growth in “convenience foods” and “cheese-rich Italian and Tex-Mes cuisines”.

Cheese is an excellent source of vitamin K2, containing both mk-4 from the butterfat and mk-7 from the fermentation. Americans love cheese and the consumption of it exploded along with the processed food industry. Think Hot Pockets, frozen pizzas and frozen burritos. Growth in pizza sales has fueled the growth in the fast food industry and artisanal cheeses have grown in popularity. Look at the growth in cheese consumption, again according to the USDA. In many ways, cheese in the latter half of the 20th century replaced the butter of the first half.
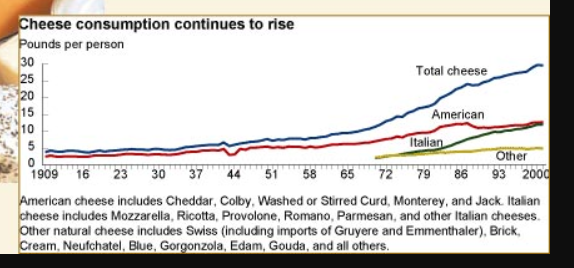
The cheese consumption curve inflects upward right around 1966. Heart disease rates basically plateaued from 1960 to 1970 and then began to really drop by 1980, coincident with the steep rise in cheese consumption.
Soybean Oil? Seriously?
Which brings us to soybean oil. I’ve not made a secret of the fact that I’m no fan of soybean oil. If you read between the lines of The ROS theory of Obesity and The Croissant Diet, you can see that I think the rise in metabolic syndrome over the past 100 years is due in no small part to the rise in consumption of polyunsaturated fats. And according to Ivor Cummins, metabolic syndrome causes heart disease. And I think he’s right!
| US Soybean Oil Consumption (g/day) | |
| 1961 | 19 |
| 1971 | 33 |
| 1981 | 45 |
| 1991 | 52 |
| 2001 | 57 |
| 2011 | 65 |
BUT! Soybean oil, by some cosmic joke, also happens to be a uniquely potent source of vitamin K1, pre-dissolved into oil, making it highly absorbable, like a pharmaceutical preparation! And guess what? We can convert vitamin K1 to vitamin K2. If we can absorb it. We probably don’t convert much but we also need very little K2 compared to K1. If 10% of the K1 in soybean oil is converted into K2 then a tablespoon of soybean oil could provide about as much K2 as a tablespoon of average sweet cream butter.
I discussed in the section about the broiler industry that humans are very bad at absorbing K1 from leafy greens. I suspect this is why the Rotterdam study found no correlation between vitamin K1 consumption and heart disease rates. The very high quantities but low absorption of K1 in leafy greens throws the correlations off.
| Food | Portion | Vit k Quantity | Vit K Form | Absorption |
| Kale | 1 cup | 81 ug | K1 | Poor (4-13%) |
| Spinach | 1 cup | 145 ug | K1 | Poor (4-13%) |
| Lettuce | 1 cup | 8 ug | K1 | Poor (4-13%) |
| Carrot | 1 small | 7 ug | K1 | Poor (4-13%) |
| Soybean Oil | 1 Tbsp | 27 ug | K1 | Excellent |
| Corn Oil | 1 Tbsp | 0.3 ug | K1 | Excellent |
| Safflower Oil | 1 Tbsp | 1 ug | K1 | Excellent |
| Butter | 1 Tbsp | 2.6 ug | k2 | Excellent |
Earlier I mentioned a Ramsden review of all the known randomized controlled trials of substituting polyunsaturated fats for saturated fats. On average these trials show no benefit for the polyunsaturates. Interestingly, though, out of the five trials, the ones that use soybean oil – an excellent source of vitamin K – show a very small, statistically non-significant benefit whereas the ones using corn or safflower oil – low vitamin K sources – show harm from the oils.

I can forgive you if you’re not wowed by this chart, but hear me out…
One confounder in this is that soybean oil is also higher in “anti-inflammatory” Omega 3 fats compared to the other two oils. Harvard’s Walter Willett, a disciple of Ancel Keys, actually explicitly says the reason that the reason the Minnesota Coronary trial failed was lack of Omega 3 fat. An interesting comparison would be an oil that was low in Omega 3 fats, had a relatively poor Omega 6 to Omega 3 ratio but was high in vitamin K.
| Vit K/100 g | Omega 6 | Omega 3 | 6:3 Ratio | |
| Soybean Oil | 180 | 51 | 6.8 | 7.5:1 |
| Olive Oil | 60 | 9.8 | 0.76 | 13:1 |
| Corn Oil | 2 | 54 | 1.2 | 45:1 |
Olive oil fits the bill here. The website of Ancel Keys own Seven Countries Study spells this out pretty clearly, “Traditional Mediterranean diets had olive oil as their principal component of fat … these cohorts were characterized by low mortality rates from CHD.”
So we can say that a major factor in common between the diets of Mediterranean people as observed by Ancel Keys in the 1950s and the American diet in 1920, where both populations had very low rates of heart disease, is that the primary dietary fat in both places was relatively high in vitamin K and relatively low in PUFA. They did not necessarily have a great Omega 6:Omega 3 ratio.
What About Smoking?
Smoking likely played a role in the rise and fall of heart disease rates but I believe it was a secondary role. As we’ve seen, Ivor Cummins pointed out that Arterial Calcium is a dramatically better predictor of heart disease death than is smoking status. Another way to say this is that a non-smoker with a high calcium score is hugely more likely to die of a heart attack than a smoker with a low calcium score. The rise of heart disease DOES parallel the rise of the heart disease death rate in the first half of the 20th century. But the fall in heart disease rates actually precedes the fall in smoking by a decade or so. You can make the argument that high heart disease death rates caused a fall in smoking rates because of public education campaigns about the risk of smoking rather than the other way around.
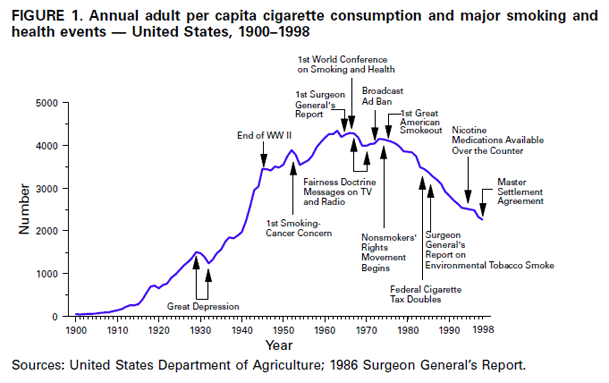
Let’s consider a 60 year who has smoked since the age of 20 before succumbing to a heart attack. In the forty years leading up to 1950, when heart disease death rates were 350 out of 100,000, average per capita cigarette consumption was 4.3 cigarettes per day. In the forty years leading up to 1990, when heart disease rates were 280 out of 100,000, average cigarette consumption was 10 cigarettes per day.
Compare this to vitamin K2. Chickens began being supplemented with menadione in the late 50s, preceding the peak in heart disease rates by a few years. The drop in butter consumption because of wartime rationing happened 15 years before the peak in heart disease rates. This is how I’d expect heart disease rates to behave – as a lagging indicator of a preceding dietary or environmental change.
The heart disease curve was likely a synergistic effect of smoking rates and vitamin K2 status but I believe vitamin K2 played the dominant role.
Conclusion
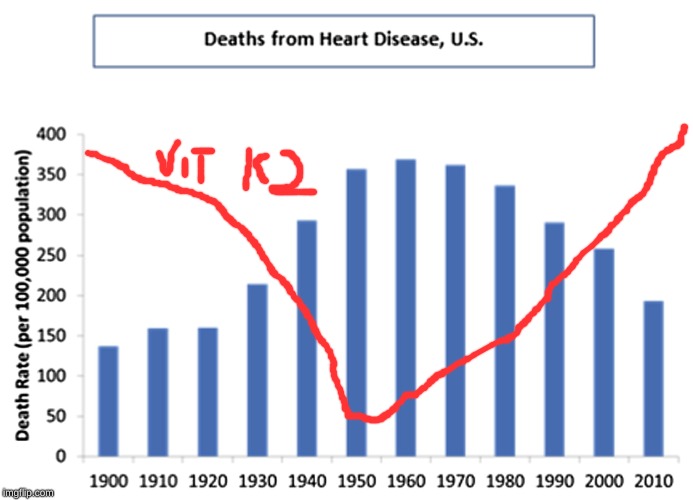
For a variety of reasons relating to the urbanization and industrialization of the American population in the 20th century, dietary vitamin K2 levels plummeted during the first half of the 20th century and rebounded in the latter half. Economic, geopolitical and agricultural factors all played a role in this. The fall and rise of vitamin K2 traces an inverse curve compared to the rise and fall of heart disease. The mechanism by which this correlation could be a causal relationship is clear: the prevention of arterial calcium deposits. In my opinion, nothing explains the rise and fall of heart disease rates in the US in the 20th century better than story of vitamin K2.

What about lead exposure? It was sharply being reduced in the 70s. Seems to coincide with the rise of lead (especially from gasoline) and the subsequent fall. Hard to tell though.
I’d say this is not a single cause thing. Smoking is definitely an important factor too. K2 does sound interesting though, does it mean we already get sufficient amounts now?
Certainly there were a lot of changes. Lead, smoking, etc.
My goal in writing the article is really to be thought provoking and show how many unrelated factors can contribute paradoxically to a dramatic drop and then rebound in a specific nutrient with a potential specific effect on health. Of course I can’t prove it. The goal is to get people thinking and talking.
Great article. Thank you.
hmm…I’ve been keto for 2 years now…blood numbers went great with reduced trigs and elevated HDLs..and lost 30lbs. That ratio
is .67..hooray! However, for the previous 6 months I supplemented with K2. I had a CAC scan after 1 year my and my score went from 199 to 248…that’s a 25% increase. I’m a 66 y/o male. Granted, the K2 supplementation was only 6 months(or 1/2) of the “test” period, I was hoping for regression, or at least less than the 15% increase that Ivor Cummins indicates your “in the clear”. I’ll keep supplementing with K2 (give it another year)but my experience does not support your hypothesis. (dang)
I’m sure it’s more complicated than JUST K2. This article is really meant to be thought provoking rather than a specific recommendation.
LOL, A couple of years ago I commented on Peter Attia’s blog when a person commented on the cause of calcium build-up in the coronary arteries. I suggested it was more about K2 than cholesterol and he ridiculed me saying it was irrelevant. Others defended me with references to the Rotterdam study.
I think K2 is very relevant.
Wow. What a great article. I’m going to share it now and hope there’s enough interest for many to read it.
Interesting hypotheses for sure. The photos of the old articles add nice supporting history.
Regarding the soybean oil and it’s omega 3 content, I was listening to the “Talking Biotech Podcast” about a high oleic soybean type and one thing that was mentioned in passing is that the omega 3 is typically refined out of most soy oil so it isn’t “fishy” smelling.
I have notice that if you grill with canola oil it can smell like salmon from the omega 3.
Do you have any idea on how prevalent this omega 3 removal is? And how would that factor in to your thoughts?
http://www.talkingbiotechpodcast.com/179-genetic-engineering-and-healthier-soybean-oils/
I don’t know about final n-3 content in soybean oil, but I do know that commercial veggie oils are called RDB – refined, deodorized and bleached – oils by the industry who produces them.
Any thoughts on why coronary heart disease is on the high pressure side of circulation? Vitamin k would be the same everywhere right?
I am really enjoying you writings.
Wanna tackle mitochondrial fusion and fission and SA metabolism
There’ll be a new post about SA metabolism this week! Mitochondrial fusion is on the list.
Wow, this is a really compelling hypothesis. I wonder if there are any existing random controlled trials that would confirm the hypothesized relationship of Vitamin K2 to cardiovascular heart disease.
Brad, how did you think of this hypothesis? In particular, how did you find out about the K supplementation in chickens and pigs?
The internet (which is always right, right?) says that in cows, organ meats (at least beef liver) are a better source of K2 than muscle meats. Another reason why a pure muscle-meat-only carnivore diet isn’t ideal.
One interesting thing about the original China Study is that wheat was strongly positively associated with CHD, and rice was strongly negatively associated with CHD (though perhaps that’s because rice displaces wheat in the Chinese diet?). I wonder why, and whether it is related to Vitamin K in any way?
I found out about the K3 in pig and chicken diets because I was formulating pig and chicken diets for a feed mill. By weight, menadione (K3) is right near the top of the list of added vitamins. organ meats are likely a little higher but menadione was a game changer for that.
I’m VERY aware of the wheat-CHD connection in China. In fact I blogged about way back in 2005. http://bradmarshall.blogspot.com/2005/12/is-wheat-killing-us-introduction-maybe.html I doubt there’s a K@ connection. My guess would be increased inflammation due to gluten reactions, but that’s a guess.
I wonder. Problem. The calcification appears to be later in plaque development. It’s a post plaque phenomenon. Also, you can get MI without calcification. How would u explain this?
My understanding, based on Ivor’s work, is that MI in the absence of calcium is exceedingly rare.
I’ve started reading all this and am intrigued. I’m familiar with Ivors work and have used fasting and keto to raise my HDL, etc. I took fairly high amounts of k2 and vitamin D3 which lowered my blood pressure.
I’m thinking of trying your diet, especially given that my biggest keto cheat was potatoes with butter.
Question: What do you think about drinking whole milk? A2 and/or organic?
I love whole milk, I am a member in a raw milk dairy CSA. I think A2 milk is probably a good idea if milk gives you digestive upset.
A problem with K1 is that it causes blood clotting, and people who have any blood clotting disease such as deep vein thrombosis are not supposed to eat foods that contain significant amounts of K1. Perhaps people with this type of disease are more likely to not be able to convert K1 to K2, I don’t know, I don’t think that has been investigated.
The fact that K1 causes blood clotting isn’t really a problem so much as a feature of the vitamin. That’s actually K1’s primary function. Without adequate K1, a person would be suffering from a form of hemophilia. Of course, excessive blood clotting is a problem, and restricting or depleting K1 can be therapeutic in such a condition, but this doesn’t imply that K1 was the problem in the first place. Restriction or depletion of K1 also replaces one cardiovascular problem with another.
The Shute brothers treated excessive blood clotting with Vitamin E, and noted overall improvement of the cardiovascular system. I believe it was them who first theorized that excessive clotting was caused by a Vitamin E deficiency. One of the things that depleted Vitamin E in the body is high dietary intake of PUFA.
Almost certainly no coincidence that here (France) cheese was always and still mostly is an essential part of lunch and, especially, dinner and that we have one of the lowest heart disease mortality rates anywhere (although that could be changing now since so many of the most vulnerable are on counterproductive statins).
Curiously, I don’t think I have ever seen cheese (& K2) given as an explanation of the ‘French Paradox’.
Interestingly, Korea also has very low rates of heart disease. Their national dish? Kimchi, a decent source of K2. Coincidence?
I think Malcom Kendrick has touched that one before, but it was a while ago and I’m too lazy to look for it. I’ve definitely seen that as a driver of heart health.
Brad, marvelously, you have pulled together into one post many interesting and likely useful insights which lay unknown to me.
as an aside, I recently had a 20 cm clot for the first time in an arm vein triggered by a canula (for ivIgG) and I have wondered if my recent n=1 testing with Thorne K2 had any role in that little escapade.
After my Coronary Artery Disease (CAD) diagnoses, I was immediately advised for a coronary angioplasty, then a stent in the artery to open it up. I was hospitalized for few weeks, I was prescribed a blood thinner and other CAD meds. After a while my condition got worse again with severe shortness of breath and angina, so i started on a natural CORONARY ARTERY DISEASE (CAD) TREATMENT from Herbal Health Point, the herbal treatment was very effective treating my heart condition and the shortness of breath. I had a total decline in symptoms. Visit their web page ww w. herbalhealthpoint. c om. Its been 2 years since the treatment, I do lots of walking and lost some weight. My daughter also used their CHF product for Congestive Heart Failure, very effective.
A very interesting article , It certainly gave me a lot to think about , Everything from what is in my food to the fact that food production is so standardized that the differences that are available for me to purchase may be not very different . For example , In the summer I was buying eggs from an Amish farm and happened to talk with the farm lady. I asked about the feed for the chickens , thinking that they were feed what was produced on the farm . She said that they buy from a coop and what ever the mix they had for that time of the year was what they used . I was a bit surprised . I don’t drive 20 miles to the farm anymore .
I was also thinking about whether the rise and fall of K2 would have had any other effects on our health . Hip fractures came to mind . If vitamin K2 strengthens bones, then the incidence of hip fractures graph might look like that of Heart attack deaths. In both cases there have been an increase in hip fractures and in one report I read the decline began in 1995 and has continued downward since . I would like to hear others thoughts on this .
Thanks
Dave
Yup! Interesting point about hip fractures. Obviously, it’s more complicated than just K2, with calcium and vit D, for instance, also being involved in strengthening bones and I’m sure other things.
Off Topic, Brad have you got any Aussie followers who may know where to get stearic acid? When I google it says it is marketed for Candles and Cosmetics, not sure if that would be food grade? Otherwise, any other ideas to source it from? Shannon (Shaza)
Hey Shannon! I DM’ed you on Twitter.
We keep five hens in our backyard. What should we feed them to ensure their eggs are high in K2 and saturated fats?
The best thing is to give them low fat grains like peas, barley, wheat or rye mixed with a commercial mineral supplement containing menadione. Unfortunately, it’s not easy to find an off the shelf product like that.
Hi Brad,
I think you are on the right track with identifying that pork and chicken are loaded with PUFA from the corn/soy feed to the point that it inhibits fat burning.
I have been doing a Keto diet going on 3 years. I have lost over 70# in the first two years 40 lbs the first year and 30 lbs the second year. It seems that I have a window in the Fall and Spring that the weight comes off easily. I think that half of it came off with the diet and the other half with IF. At first I could do extended fasting with fabulous results that eventually diminished. I have also increased the fatty pork content of my diet considerably by eating bacon, sausages and salami’s.
I’m only 5′ tall and down to 155 lbs so my 70lb weigh loss has been fantastic for me. I’d like to get another 20lbs off that are stuck. I’m going to go pork and chicken free and increase butter and beef.
I think that you have retained a great deal of metabolic flexability and can burn glucose without storing it as much. I find if I eat a high carb meal, I gain weight immediatly as I am not as met-flex as you.
Thanks for the great info.
Kevin
Good luck, Kevin! Thanks for sharing.