
I’ve been promoting the OmagaQuant complete test as a way to calculate your Desaturase Indix (DI or DI18) to know your SCD1 levels. This is calculated by dividing your oleic acid (18:1) by your stearic acid (18:0). There are a lot of questions about what people’s numbers SHOULD look like. Ideally your DI should be low. But how low? I did a deep dive of the literature to pull the historical comparisons that are an apples-to-apples comparison with the OQ test: all red blood cell membrane phospholipids. Some of the papers compare healthy individuals with diabetic individuals. I am only presenting the healthy individuals here.
| US ’64 | China ’92 | Italy ’87 | Finland ’87 | US ’87 | France 2014 | Me Nov 2020 | |
| Omega 3 | 8.33 | 2.39% | |||||
| Alpha-Linolenic(18:3n3) | 0.24 | 0.22 | 0.22 | ||||
| EPA (20:5n3) | 1.3 | 0.35 | 0.97 | 0.39 | |||
| DPA (22:5n3) | 2.5 | 0.47 | 2.23 | 0.77 | |||
| DHA (22:6n3) | 5.3 | 1.26 | 2.7 | 0.48 | 1.1 | 4.51 | 1.01 |
| Omega 6 | 29.92 | 29.02 | |||||
| Linoleic (18:2) | 11.0 | 21.0 | 8.6 | 13.1 | 12.2 | 12.87 | 16.09 |
| GLA (18:3n6) | 0.09 | 0.26 | |||||
| Eicosadienoic (20:2n6) | 0.20 | 0.27 | |||||
| Dihomo-gamma LA (20:3n6) | 2.2 | 1.5 | 1.0 | 1.3 | 1.56 | ||
| Arachidonic (20:4n6) | 21.7 | 6.6 | 17.2 | 17.2 | 18.5 | 13.0 | 8.89 |
| 22:4n6 | 3.4 | 2.0 | 1.49 | ||||
| 22:5n6 | 0.5 | 0.35 | 0.46 | ||||
| Mono | |||||||
| Palmitoleic (16:1n7) | 0.61 | 3.03 | |||||
| Oleic (18:1n9) | 17.1 | 12.9 | 26.2 | 25.6 | 25.4 | 15.16 | 23.19 |
| Eicosenoic (20:1) | 0.85 | 0.21 | 0.16 | ||||
| Nervonic (24:1) | 0.8 | 1.2 | 0.69 | 1.35 | |||
| Saturated | |||||||
| 14:0 | 0.3 | 0.43 | 1.34 | ||||
| 16:0 | 20.2 | 28.0 | 17.8 | 22.0 | 18.0 | 20.6 | 25.29 |
| 18:0 | 19.3 | 20.2 | 11.4 | 22.3 | 24.0 | 14.1 | 10.83 |
| 20:0 | 0.15 | 0.26 | |||||
| 22:0 | 0.23 | 0.33 | 0.75 | ||||
| 24:0 | 0.8 | 0.18 | 0.74 | 1.29 | |||
| Ratios | |||||||
| DI18 (18:1/18:0) | 0.89 | 0.64 | 2.3 | 1.1 | 1.1 | 1.1 | 2.1 |
| DI16 (16:1/16:0) | 0.030 | 0.12 | |||||
| DI1600 (16:1/16:0*100) | 3 | 12 | |||||
| D5D (20:4n6/20:3n6) | 3 | 10.0 | 5.7 | ||||
| D6D (20:3n6/18:2n6) | 0.10 | 0.10 | 0.10 |
The foundational paper in this field was done at The University of Washington on healthy young adults in 1964.1 Diet isn’t mentioned but it’s fair to assume they were eating a fairly standard American diet of flour, potatoes, sugar, dairy, meat, vegetables and fruit. Probably some alcohol. This paper established the relative ratio of the major classes of phospholipid – phosphtidylcholine, phosphotidylserine and phosphatidylethanolamine – and the fatty acid composition of each class. Which is fun because in order to compare it to the OmegaQuant test you actually have to put all of the numbers into a spreadsheet and do the math…
The next paper2 is from China looking at the fat composition of children eating rapeseed oil, not very much: “fat intake could even be as low as 11% of total calories, rapeseed oil is the main source of edible fat, contributing about 44% of the total fat intake.” “The main staple food is wheat, the main vegetables are spring potato and cabbage. Sometimes bean curd, seldom pork, and never fish or dairy are consumed.” This population has the highest amount of saturated fat, the lowest DI and the highest ratio of Omega 6 linoleic acid to omega 6 arachidonic acid of any population studied.
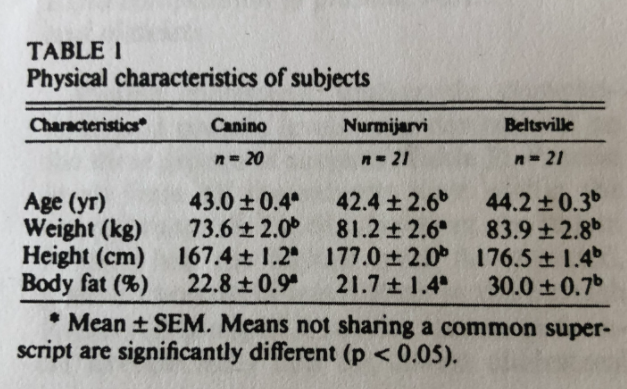
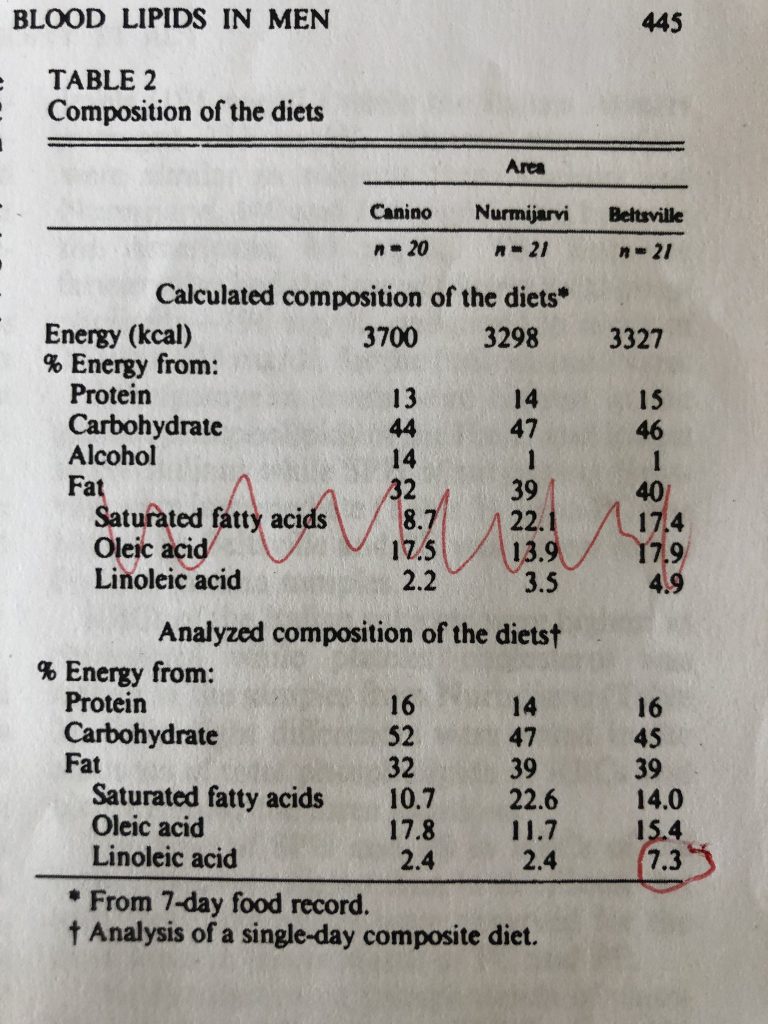
The next study3 has the three populations from 1987 – one each in Italy, Finland and the US. The participants were all men working in either farming or forestry who consumed less than 100g of alcohol per day and who smoked less than one pack of cigarettes. We are given a very brief synopsis of the physical characteristics and regional diets. They actually analyzed the foods being eaten! The Italians (BMI 26.3) get 14% of calories from alcohol and much of their dietary fat from olive oil. They had the least linoleic acid of anyone studied, presumably the oleic acid in their diet was substituting for PUFA. They have the highest DI by a LOT but it’s hard to tell if this is from dys-regulation or from dietary oleic acid. My guess is the second. The Finns (BMI 25.9) eat the most saturated fat, have the lowest BMI, the lowest body fat percentage and a DI of a very respectable 1.1. The Americans (BMI 26.9) have the highest BMI by a little but the highest body fat percentage by a lot. They eat triple the PUFA of the Europeans, but they are not dys-regulated yet. At 7.3% PUFA they are approaching the threshold, but their DI is still great at 1.1.
The French study4 gives very little information about the ages, gender or diet of the patients. We know they are non-diabetic. I presume they are eating baguettes and soft cheese and drinking wine.
The final column is me. I grew up in a household with only margarine, no butter. Salad was served at every dinner, which meant Kraft Thousand Islands dressing. My dad maniacally cut every bit of visible fat off of the meat we were served. I learned to use Thousand Islands dressing as a steak sauce since the steak was lean and dry. I ate school lunch. I am dys-regulated. That’s OK. The long term goal of this blog is to see if we can fix people like me.
I decided against including this British Study…5 The fat numbers just don’t add up. I have more questions than answers. For instance, they reported only 1.65 percent arachidonic acid but 13% 22:4n6? And nervonic at 3.3%? Something just seems off.
- 1.Ways P, Hanahan DJ. Characterization and quantification of red cell lipids in normal man. Journal of Lipid Research. Published online July 1964:318-328. doi:10.1016/s0022-2275(20)40200-7
- 2.Laryea MD, Jiang YF, Xu GL, Lombeck I. Fatty Acid Composition of Blood Lipids in Chinese Children Consuming High Erucic Acid Rapeseed Oil. Ann Nutr Metab. Published online 1992:273-278. doi:10.1159/000177729
- 3.Dougherty RM, Galli C, Ferro-Luzzi A, Iacono JM. Lipid and phospholipid fatty acid composition of plasma, red blood cells, and platelets and how they are affected by dietary lipids: a study of normal subjects from Italy, Finland, and the USA. The American Journal of Clinical Nutrition. Published online February 1, 1987:443-455. doi:10.1093/ajcn/45.2.443
- 4.Koehrer P, Saab S, Berdeaux O, et al. Erythrocyte Phospholipid and Polyunsaturated Fatty Acid Composition in Diabetic Retinopathy. Stitt A, ed. PLoS ONE. Published online September 4, 2014:e106912. doi:10.1371/journal.pone.0106912
- 5.Patel PS, Sharp SJ, Jansen E, et al. Fatty acids measured in plasma and erythrocyte-membrane phospholipids and derived by food-frequency questionnaire and the risk of new-onset type 2 diabetes: a pilot study in the European Prospective Investigation into Cancer and Nutrition (EPIC)–Norfolk cohort. The American Journal of Clinical Nutrition. Published online September 22, 2010:1214-1222. doi:10.3945/ajcn.2010.29182
I started researching this topics I found this paragraph I consider interesting:
“In some obese insulin-sensitive patients, a decreased level in Firmicutes is associated with the downregulation of WAT browning. Interestingly, the Firmicutes level was found to be directly correlated with PRDM16 mRNA expression (a key transcription factor involved in BAT differentiation) and UCP-1 expression in subcutaneous and visceral WAT [247]. In accordance with theory, regimen seems to have a direct impact on browning through microbiota regulation. Indeed, intermittent fasting is associated with body weight decrease and WAT browning, also by increasing the Firmicutes level [248]. Underlining once again the role of gut microbiota, intermittent fasting does not promote WAT browning in germ-free mice [248]. Similar results were obtained with caloric restriction [249]. Finally, cold exposure also impacts gut microbiota composition in mice, again by increasing the Firmicutes level [250].”
Something is off in American 64 data as well. The total fat percentages are exceeding 100%.
It appears that body prefers about 30% omega-6 in RBC phospholipids. Which is the level reached by starch eating Chinese and saturated fat eating French and Finns.
It would be interesting to find about about fat composition of low-PUFA and low-starch eaters such as Peter of HyperLipid. It might be that their PUFA might be saved for phospholipids and would show similar pattern.
Also, it seems mostly vegetarian starch eaters have low AA and higher LA while reverse is true for meat-eaters
Did I miss it?
What is the estimated optimum ratio?
Based on the data it looks like <1 and anything over about 1.2 or so is starting to get bad.
Am I close?
I’m not trying to say “here is the optimal range” I’m just saying “here is the historical range”. But yes, the historical range seems to be 0.6-1.2, so that’s probably optimal.
N\Brad
Thanks Brad!
I just got my Omegaquant test results 10 minutes ago, and if I did this right (Olec 21.82% & Stearic 11.68%), my ratio is about 1.9.
I am a almost 39 year old 6′ 6″ 265ish male.
Starting Monday I am going to go hard on keeping PUFA & MUFA as low as I can in my diet add your ghee to lots of stuff (mostly for breakfast though), take your oil in the afternoon, and add fish oil &, maybe, Berberine in the evenings (along with some more basic vitamins & minerals). Going to try and follow as many other diet pointers as I can as well.
Other than my birthday in April I am going to be as strict as I can for a month and see what happens.
DI results of around 1.9 seem to be pretty par for the course in modern Americans. This differs pretty dramatically from older generations and populations such as China and France on more traditional diets.