
Introduction
If you follow this blog you probably won’t be SHOCKED that I’m following up Metabolic Rates in American Women Plunged Between 1919 and 1986 with this post. The same group that did the 1986 paper about metabolic rates in women followed it up with a paper about men in 1987.1 They conclude, “The classic prediction equations and tables overestimate RMR of men.” (RMR: resting metabolic rate).
The most classic equation is the Harris – Benedict equation.2 It was published in 1919 based on measuring the metabolic rates of 136 men as measured at Wellseley college. The equation gives a predicted RMR based on a person’s gender, height, weight and age. By 1987 it systematically overestimated the metabolic rates of American men, which means that the equation was wrong or that metabolic rates dropped. My money is on the latter and I will have follow-up posts to that effect. My argument is that the Harris-Benedict equation continued to accurately predict metabolic rates in much of the world well after 1987, including (for instance) in Italy in 2001.3
The Harris-Benedict equation, developed in the US Northeast, accurately predicted Italian metabolic rates in 2001 but overestimated American metabolic rates in 1987. So is the equation wrong or did American metabolic rates drop?
Charts and Graphs!
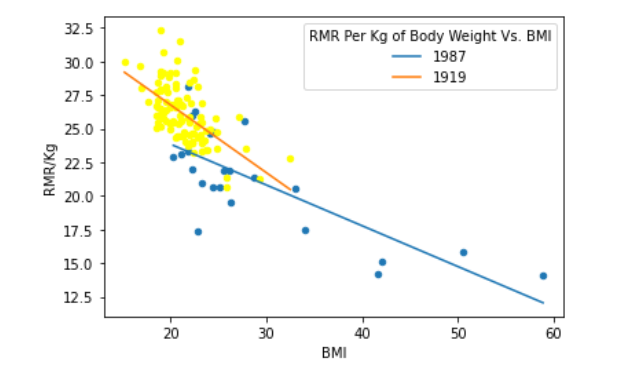
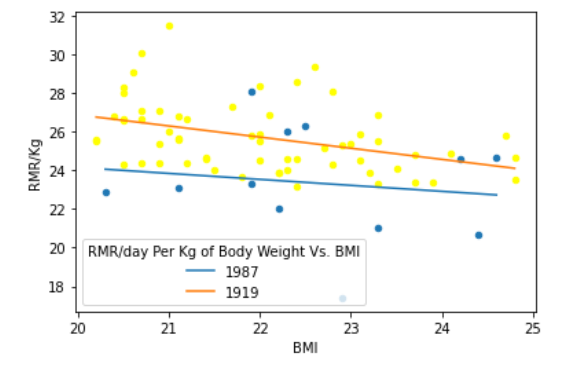
I plotted all 60 men in the 1987 study and all 136 from the 1919 study. Attached at the end of the article is the CSV file with all of the data and my Jupyter Notebook if you want to see the raw data.
| RMR/Kg 1919 | RMR/Kg 1987 | |
| Men Below 30, BMI 20-25 | 25.7 | 23.3 |
Conclusion
Men of the same age and weight had a lower metabolic rate in 1987 than they did in 1919. The difference was around 2.4 calories per kg per day – that’s around 175 calories for a 150 lb male, an equivalent drop to what was seen in women over the same time period.
Check back in next week, we’re going to do a world tour of metabolic rates!
- 1.Owen OE, Holup JL, D’Alessio DA, et al. A reappraisal of the caloric requirements of men. The American Journal of Clinical Nutrition. Published online December 1, 1987:875-885. doi:10.1093/ajcn/46.6.875
- 2.Harris J, Benedict F. A Biometric Study of Basal Metabolism in Man. Carnegie Institution of Washington; 1919.
- 3.De Lorenzo A, Tagliabue A, Andreoli A, Testolin G, Comelli M, Deurenberg P. Measured and predicted resting metabolic rate in Italian males and females, aged 18–59 y. Eur J Clin Nutr. Published online March 2001:208-214. doi:10.1038/sj.ejcn.1601149
Very interesting, as was the post on american women. I wonder if this was normalized for lean body mass versus total body mass if the numbers would be closer. I would think as the increased body weight is from adipose that it would increase mass but not metabolic rate.
Good point, Steve. Probably no one measured this (DEXA scans weren’t available). Listening to a book about Abraham Lincoln, and he was known for chopping wood. That’s what he did a ton of. In fact, his dad had him doing that for others, to make money. As a person who graduated from high school in 1986, I can confidently say I have never chopped wood.
Now, playing football got me into good shape back then, but a “normal”, non-sports male probably wouldn’t have near the physical musculature Lincoln had. While he was gangly, he was known to be strong.
Whether males attending college (Lincoln never went to college and taught himself how to read) in 1919 would have similar intense physical labor, it’s hard to say.
Very good point I didn’t consider. College attendance was much more restricted in those days and they probably wouldn’t have that amount of physical labor. I can’t speak on how much they actually got though.
This is certainly possible but fails to explain why the old equation still worked in Italy in 2002.
Brad
Excellent point. I think you’re definitely on to something.
A few years old, but focused on both absolute amounts and lipid ratios. “Bees fed an omega-6:3 ratio of 1, with 4% total lipid concentration achieved the best performance. Our results with honey bees are consistent with those found in mammals. Best cognitive performance is achieved by a diet that is sufficiently rich in essential fatty acids, but as long as the omega-6:3 ratio is not high.”
Arien et al 2018 Omega-6:3 Ratio More Than Absolute Lipid Level in Diet Affects Associative Learning in Honey Bees. https://dx.doi.org/10.3389%2Ffpsyg.2018.01001
Suggests to me the need for these lipids is evolutionarily ancient as is the importance of the ratio between them. One of your earlier posts also touched on the ratio as being very important.
I suspect the ratio of Omega 6:3 IS important as is reducing the absolute amount of PUFA.
OMG. IN 2021 So many negative issues that challenge both men and woman and some are latterly bad news that contributes to physical inflammatory response with pain symptoms that can be totally mediated by group therapy in eliminating exposure to bad thoughts that trigger biological negative response’s with physical inflammatory pain. New born babies in a study confirmed two hundred eighty toxins in the babies umbilical cords of hundreds of newborns. The list goes on and on and the exposer is inescapable because of the toxin in all food products sold In USA AS WELL AS THE WATER.