
Intro
I have suggested that increased consumption of the Omega 6 polyunsatured fat (PUFA) linoleic acid throughout the 20th century has led to an American population where the majority of us are in a torpor-like state as defined by high levels of stored PUFA in our bodyfat coupled with high expression of the transcription factor PPAR gamma and it’s target gene SCD1. Symptoms of this torpor state include low body temperature, low metabolic rate and increased fat storage. I have previously shown that the consumption of PUFA drops the body temperature of mice, that the body temperature and metabolic rate of a starch eating South American tribe dropped given access to vegetable oil and that the saturation level of Americans stored bodyfat dropped dramatically between 1961 and 1992. Previously I showed that the body fat of obese adults is highly unsaturated. Furthermore, the last two links demonstrate a parallel rise in both stored PUFA and monounsaturated fats (MUFA). In a non torporous state, PUFA should suppress the enzyme SCD1 and therefore lower MUFA. PUFA and MUFA rising together is a sign of torpor.
If all of this is true then we should expect measured Resting Metabolic Rates (RMR) of women to have decreases as the 20th century progressed.
Summary
- Women’s Resting Metabolic Rates (RMR) dropped between 1919 and 1986
- In a woman below 30 weighing 130 lbs, the drop was about 180 calories per day while chilling in a chaise lounge
- That’s 20 lbs of butter over one year
- Metabolic rates were higher in 1919 for all ages and BMIs of women
- Trained athletes in 1986 had lower RMRs than non-athletes on a college campus in 1919
- Plotting metabolic rate per kilogram vs. BMI really showcases the differences between 1919 and 1986
- The difference in RMR is highly statistically significant
The Data
Luckily, the tools to measure RMR are relatively simple and we could do it over a century ago. Harris and Benedict published their landmark book on the subject1 in 1919, including the individual heights, weights and metabolic rates of over 103 women performed in the lab at Wellesley college, an elite New England women’s college. The women ranged from 15 to 73 years of age with BMIs from the teens up into the mid 30s. Harris and Benedict made an equation to predict someone’s RMR based on their age, height, weight and gender known as the Harris-Benedict equation, which is still in use today.
In 1986, Owen published A reappraisal of caloric requirements in healthy women2, concluding that “the currently available tables and regression equations (including the Harris-Benedict equation) overestimate the RMR of healthy women by 7-14%”. An equation developed to predict metabolic rate in 1919 overestimated the metabolic rates of women in 1986. A great thing about this paper is that 1) it gives us the heights, weights and metabolic rates of 44 individuals, not just the mean number like most papers and 2) they include 8 trained athletes, so we can’t assume that the lower metabolic rates seen in the paper are due to sloth.
I plotted out all 147 women from both papers. I’ll post the spreadsheet and my Jupyter Notebook at the end if people want to look at the data.
Here is the metabolic rate of all women below age 30, 1919 vs. 1986, plotted against their weight.
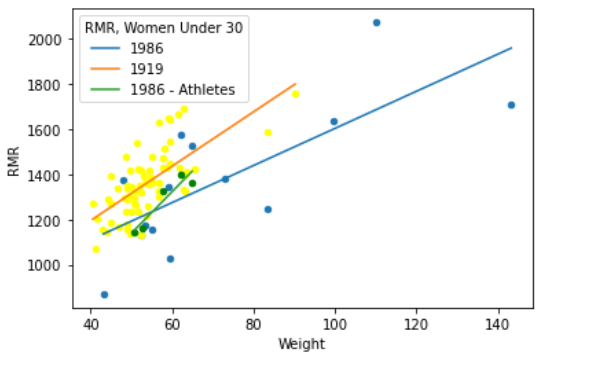
A 60 kilogram woman (132 lbs) in 1919 burned on average an additional 180 calories per day than a woman of the same weight in 1986 while lying in a chaise lounge. To put that into perspective, it’s the difference of 20 pounds of butter per year.
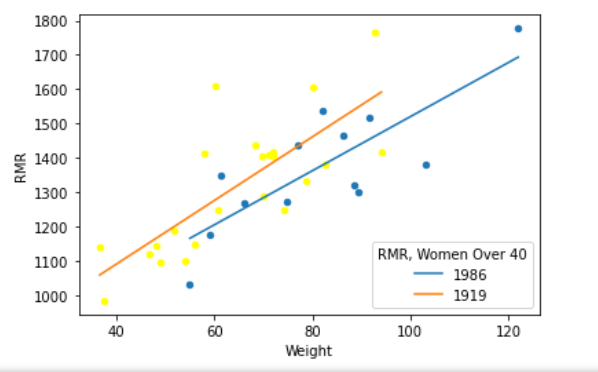
Even trained athletes in 1986 had lower RMRs than average University students did in 1919. The differences persisted in older women:
I also plotted RMR per kilogram of body weight, thinking that this looking at BMI would control somewhat for body type given the limited data. This is in women below 30 again. If anything, this accentuates the differences between the groups. When you look at BMI, there are almost no women from 1919 below the trendline from 1986 nor women from 1986 above the trendline from 1919. No matter how you look at it, metabolic rates dropped significantly between 1919 and 1986:
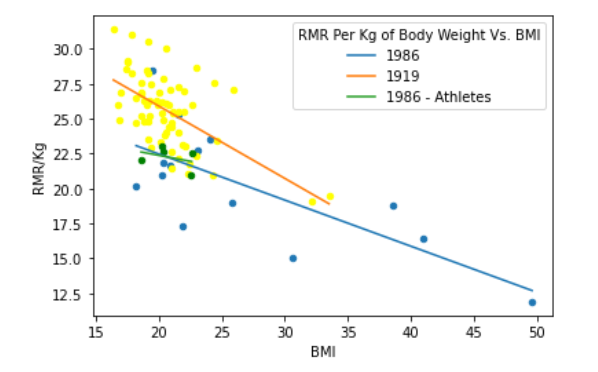
The trends move lower as BMI increases because this stat is per kg and fat tissue is metabolically less active than muscle.
I even did a statistical analysis to show that the measured RMRs from 1919 are significantly higher than those from 1986.
| Mean RMR/Kg 1919 | Mean RMR/Kg 1986 | P-Value |
| 25.6 | 20.8 | 0.001 |
| Methods: Cut and paste from Stack Overflow. I got this solution from S Anand. It’s in the Jupyter Notebook posted below. | ||
Nerd Alert
This was my first project using a Jupyter Notebook. What amazing tech! Huge shout out to anyone involved in developing Python, pandas, NumPy, SciPy, etc! And of course those involved with the Jupyter Notebook project! And also to all of you who post such great solutions on Stack Overflow. Sometimes I say I’m a coder, which is to say I’m clever enough to cut and paste solutions from Stack Overflow and change the variable names.
Also check out the Fire In a Bottle Jupyter Notebook Github repo although there’s not much there yet.
- 1.Harris J, Benedict F. A Biometric Study of Basal Metabolism in Man. Carnegie Institution of Washington; 1919.
- 2.Owen OE, Kavle E, Owen RS, et al. A reappraisal of caloric requirements in healthy women. The American Journal of Clinical Nutrition. Published online July 1, 1986:1-19. doi:10.1093/ajcn/44.1.1
A chilling tale Brad (pun intended)
Thank you for digging up this information.
Very illuminating for many frustrated women who tried everything to lose some weight and were mocked in the process.
Is there any hope if we avoid PUFA’s now? It begins to feel like we are doomed either way.
I’m hoping that by avoiding PUFA, stimulating PPAR alpha with things like berberine or g pentephyllum and perhaps by inhibiting SCD1 with Sterculia Oil we can dig our way out over time.
For you menfolk out there, the next post is going to be “Metabolic Rates in American Men Plunged…..”.
Brad
Pardon me for leaving this in a random spot, but since there’s no general place to post things. This just popped up in my RSS feed re: PPARa
https://www.fightaging.org/archives/2021/03/ppar%ce%b1-slows-atherosclerosis-by-inhibiting-vascular-cellular-senescence/
Crisco was introduced in 1911.
Your data makes sense but the final chart says 1919 20.8 for RMR/kg vs 25.6 for 1986. Wouldn’t this be reversed? It appears to be in your plot but I just wanted to verify.
Doh! You’re right. Fixed now.
A statistician here (again).
Low p-value does not mean that there is a significant difference between the groups. Based on some arbitrary cutoff point of p<0.05 the tradition would be to say that the difference is _statistically_ significant, which tries to express the idea that if there actually was no difference, then seeing more extreme data than this one would be quite rare.
Significance is about how meaninful in practice is the difference between the groups. P-value has nothing to do with that. With enough data a meaningless difference of 0.00001% can have a very low p-value.
Low p-value also does not prove or disprove any difference. It is just a simple measure of conflict between the null hypothesis of no difference and the observed data. It does not say anything about other hypotheses about the difference, and how well they might fit the data.
In this case most important "proof" are the plots, which show the situation quite clearly. Especially the plot with RMR/kg is a good idea. If formal statistical inference would be of interest, then it would be best to concentrate on the parameters of the regression lines that you plotted. For example, what would be the 95% probability interval for the difference between the intercept parameters of these regression lines? Are the differences in this interval all meaningful in practice?
If you need help from a statistician, feel free to reach me out. What you do is very important for the mankind, and I would be glad to help.
Samu that was very good explanation. I felt. I just had a statistics 102 revisit ( which I appreciate)
What about the amount of exercise? Perhaps something like this:
https://pubmed.ncbi.nlm.nih.gov/14692598/
That is, if you’re outside chopping wood a lot (listening to a story about Abraham Lincoln, and that’s what he did), you’ve got to have a lot of extra muscle mass that you might not have today. That would have to make your RMR higher.
First they ignore you…….. https://jayfeldmanwellness.com/ep-47-a-critique-of-the-ros-theory-of-obesity-the-croissant-diet-part-1/ https://jayfeldmanwellness.com/ep-48-a-critique-of-the-scd1-theory-of-obesity-the-croissant-diet-part-2/ The Peatarians are on your case!!
Yes, I’ve actually listened to both of these. I was going to post the links on the blog. The first one was pretty decent, the second one seems to miss the point entirely. They get really hung up on the fact that I say that a little PUFA suppresses SCD1. Which is true in very tiny amounts, but really the point is that if you eat too much, Omega-6 PUFA, it actually INCREASES SCD1.
That’s the point of The SCD1 Theory of Obesity. SCD1 gets upregulated IN PARALLEL WITH Omega 6 PUFA. This is either 1) dysregulation or 2) a pre-programmed mamalian torpor program kicking in. They don’t even mention the co-regulation of PUFA and SCD1.
Brad
What is your opinion regarding their stance on fructose and fish oil?
I don’t think that fish oil is always bad nor do I think that fructose is particularly good? Or bad… I’m kind of down the middle on both.
Since you’re interested in French cuisine! https://medium.com/@rnikoley/did-food-enrichment-cause-the-obesity-epidemic-c9d083eb49bf
Something else you aren’t taking into account, Brad, is another very significant change in modern cuisine that I hope you look into as well:
Plastics, pesticides and other estrogenic foods.
Micro plastics have been found in our food (even in the muscle of cows), our water is full of hormones from birth control medications, the soil itself is polluted with microplastics. Many pesticides have been shown to have estrogenic effects as well. I am strongly of the mind that these pollutants are also wreaking havoc on our hormone balance and contributing to weight gain, cancer and metabolic diseases.
Buying organic (for the pesticides, I have no issue with GMO), grass fed meat, switching to glass only and filtering your water (brita) are some things you can do. I am not sure if the body can shed these pollutants effectively once consumed but every little bit helps, especially with kids!
You are probably right, but there are only so many hours in the day. I may have to leave this to someone else for the time being.
According to this site https://selfdecode.com/gene/scd/#all-ways-to-increase-gene BPA (eg plastic water bottles) increase SCD (click on Substances that increase SCD). I wonder if there is much BPA in Brita water pitchers.
BTW, as far as I know most GMO crops are developed to be Roundup resistant. For example, they spray the crap out of potatoes just before harvesting.
Random question here: would there be a problem with taking kratom raw leaf (that is, mitragyna speciosa powder) for joint pain/bursitis(inflammation)? I recently woke up (literally!) with bursitis in my hip, & my son said to consider taking this. I need to know if it interferes with the croissant way of life.
Umm… I don’t know anything about mitragyna speciosa. That’s probably not helpful. Sorry!
My son got addicted to Kratom, the withdrawal was difficult. This was a gateway “supplement” for him and it led to stronger opioids and he ended up in rehab.