
Hap MD asked me if I had any thoughts on Ossabaw pigs. They are interesting because they are one of the only animals other than humans who spontaneously have heart attacks (the only?). Ossabaw piings are descended from Spanish pigs that were dropped on Ossabaw island off of the coast of Georgia, United States, in the 16th century. They developed dwarfism, typical of large mammals confined to islands, as well as a “thrifty phenotype” – the ability to preserve their fat mass with limited calories.
One of the known genetic adaptations of the Ossabaw that predispose them to metabolic syndrome is a mutation in their AMPK gene that affects both their fat and carbohydrate metabolism.1 AMPK is a crucial part of leptin signalling.
Pigs are also a great model animal to study human metabolism. They are omnivorous monogastrics with a similar size digestive tract and similar sized organs to humans. Unlike mice, which are often used in metabolic research, they have a relatively small amount of brown adipose tissue, just like humans. Brown adipose tissue has a very high metabolic rate and is a confounder in rodent models of obesity.
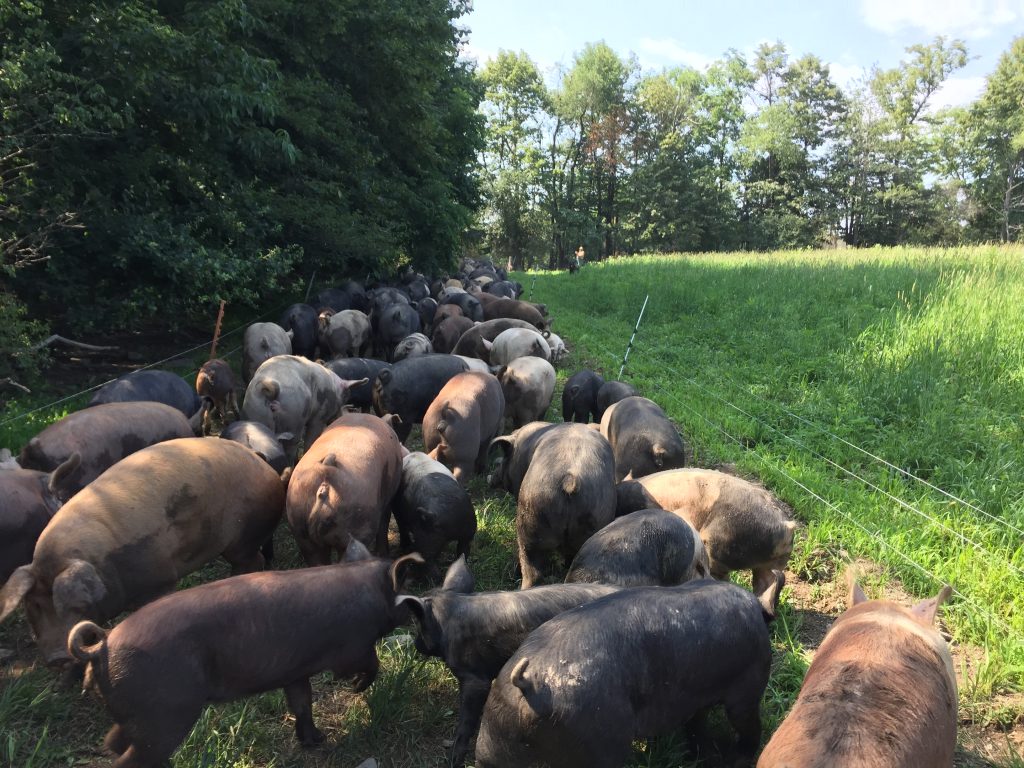
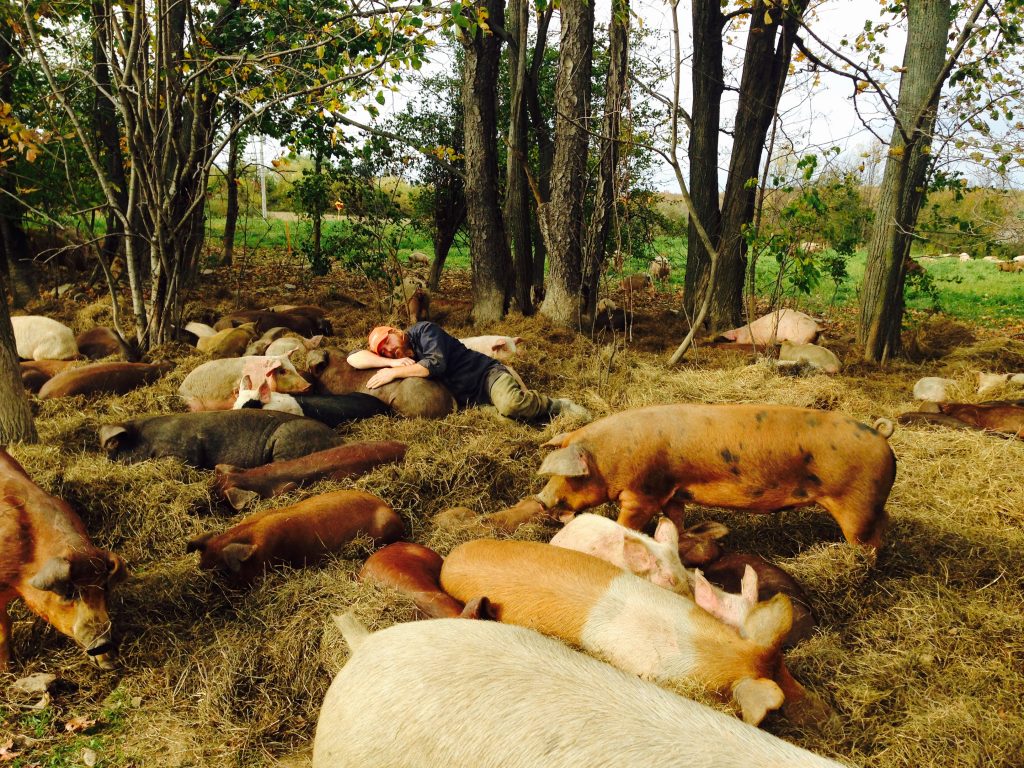
Plus I spent 15 years raising pastured hogs so I’d like to think I know a thing or two about them! I’d been meaning to look through the pig research again since I know it’s an interesting model. This was the excuse that I needed.

A Feeding Trial That Summarizes FIAB Concepts
Soon I stumbled across a paper2 that neatly demonstrates most of the concepts that I’ve talked about on this blog in a model organism that is probably about as close to an obesity prone human as you can find.
This is a pretty straight forward feeding trial. They gave three groups of young, growing pigs different diets for 8 weeks and then measured what happened. This is a pretty short duration for this kind of trial, yet they managed to induce full blown torpor in one group of pigs by feeding them tons of regular soybean oil.
Another group was given a modified soybean oil with less alpha-linolenic acid (ALA). ALA is the most common omega-3 fat found in plants. It is more unsaturated than linoleic acid. We know that omega-3 can induce torpor because bears and salmon. As I mentioned in my last post, it is mostly linoleic acid’s oxidized metabolites (OXLAMS) that activate PPAR gamma. It’s hard to understand the dynamics of linoleic acid oxidizing into OXLAMS in an 8 week trial. According to the paper, ALA “oxidizes twice as quickly as linoleic acid [C18:2(n-6)] under stable conditions”. Introducing ALA ensures sufficient oxidized PUFA to activate PPAR gamma in short order.
The author’s logic for removing the ALA had nothing to do with PPAR gamma. It’s contorted and goes like this: obesity is a disease of inflammation. PUFA reduce inflammation. But they oxidize, which is bad, so we removed the omega-3 PUFA because it is more likely to oxidize. Even though it has the most potent anti-inflammatory activity. Did you follow that?
The Experiment
Things to keep in mind about the study:
- It is short in duration, only 8 weeks
- These were rapidly growing piglets and so they have a huge metabolic rate and therefore have high turnover of old fat stores and are adding new ones rapidly
- The consumption of PUFA is VERY high compared to their body size – 130g/day on average for animals that only started at 14kg (30 lbs) and weighed 40kg at the end (90 lbs). Contrast this to the average american who might weigh 160 lbs and consume 40g of PUFA in a day (my guesstimate)
- This is a breed of pig who easily develops metabolic syndrome
All of this combines to make a situation where metabolic changes that might happen in an adult human over a period of years (or generations) can be seen in Ossabaw pigs in just weeks.
Here’s what they did. One group of pigs (control group) got a standard low fat pig diet. Two groups of pigs got 45% of their calories as soybean oil. One group (low omega-3 group) got soy oil that had most of the omega-3 fat removed. Another group got regular soybean oil with it’s ~7% content of ALA omega-3 PUFA (regular soy oil group). The feed was fed ad lib – the pigs ate as much as they wanted.
The results are fascinating. The control group ended up like normal pigs. The normal soy oil group ended up torpid with insulin resistance and metabolic syndrome. I’m more and more wondering if those are just different words for the same thing.
The group given the low ALA soy oil is most interesting of all. They appear to be well on their way to torpor as indicated by their DI1600 (more on this later), but they’re not torpid YET. In fact, they seem to be in a state of what Peter from Hyperlipid would call “pathological insulin sensitivity”. They have accumulated enough linoleic acid that they can’t generate much ROS in the mitochondria to drive physiolocially appropriate insulin resistance but they haven’t yet shifted into full blown torpor. Remember, it was only 8 weeks. This is the intermediate step.
LITERALLY THE ONLY DIFFERENCE BETWEEN THE INSULIN SENSITIVE PIGS AND THE INSULIN RESISTANT PIGS IS A FEW PERCENT OF ALA!!
| Low Fat | Low n3 Soy Oil | Soy Oil | |
| Dietary Intake | |||
| Calories | 4698 | 5394 | 5533 |
| Carbohydrate (g) | 834 | 554 | 569 |
| Fat (g) | 55 | 245 | 251 |
| Protein (g) | 217 | 243 | 249 |
| Linoleic Acid n6 (g) | 28 | 130 | 126 |
| a-Linolenic acid n3 (g) | 2.2 | 4.5 | 17.6 |
| Palmitoleic Acid 16:1 (g) | 0.18 | 0.29 | 0.24 |
| Oleic acid (g) | 13 | 46 | 49 |
| Corn Syrup (g) | 0 | 60 | 60 |
| Omega 6/Omega 3 Ratio | 12.4 | 29.2 | 7.5 |
| Serum Fat Composition (%) | |||
| Palmitic Acid 16:0 | 23.1 | 19.3 | 20.2 |
| Palmitoleic Acid 16:1 | 1.25 | 1.18 | 1.60 |
| Stearic Acid 18:0 | 15.8 | 11.9 | 12.0 |
| Oleic Acid 18:1 | 35.4 | 31.5 | 38.8 |
| Linoleic Acid | 14.3 | 25.8 | 11.6 |
| Desaturase Index (DI1600) | 5.4 | 6.1 | 7.9 |
| Blood Markers | |||
| Free Fatty Acids | 0.17 | 0.32 | 0.28 |
| Glucose | 8.8 | 7.8 | 9.6 |
| Insulin | 6.9 | 1.7 | 30.9 |
| Triglycerides | 0.5 | 1.0 | 1.5 |
| LDL | 0.8 | 0.9 | 4.7 |
| HDL | 0.31 | 0.25 | 0.14 |
| Inflammatory Markers | |||
| C-Reactive Protein | 101 | 65 | 46 |
| IL-6 | 0.57 | 1.35 | 1.71 |
| TNFa | 0.87 | 1.67 | 1.07 |
| Body Weight | |||
| Starting Weight (kg) | 13.9 | 14.2 | 13.7 |
| Ending Weight (kg) | 38.3 | 39.3 | 40.3 |
| Weight Gain (kg) | 24.4 | 25.1 | 26.6 |
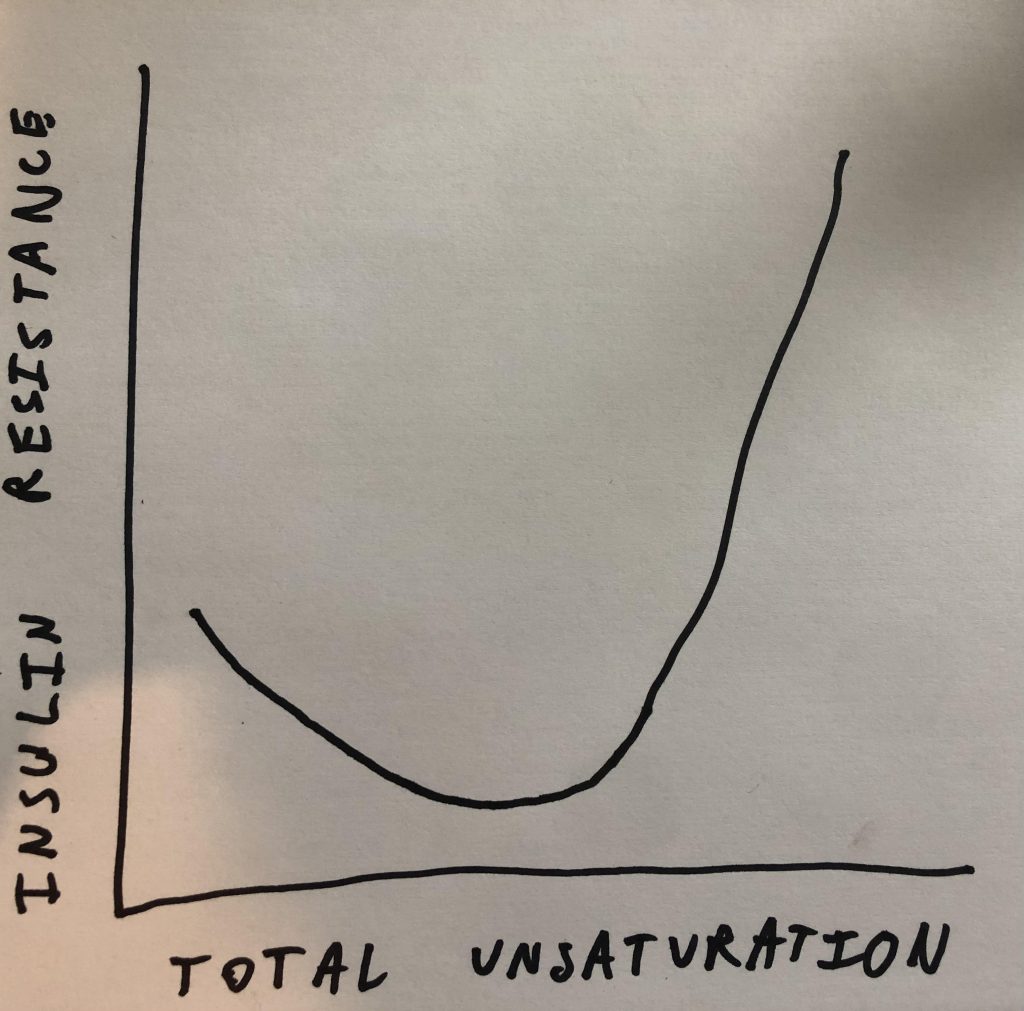
One of the more confusing topics that I’ve talked about on the blog are u-shaped curves. Specifically I’ve said that a little bit of PUFA suppresses SCD1 expression and a lot of it increases it. In this experiment the u-shaped curve has to do with insulin sensitivity. Eating a bunch of linoleic acid made the group of low omega-3 pigs exquisitely insulin sensitive in the short term. If you add a little bit of PUFA that has a third unsaturated bond… Poof! The animals are now completely insulin resistant.
The DI1600
I’m introducing a new desaturase index that I made up called the DI1600. To this point I’ve mostly focused on DI18: the ratio of oleic acid to stearic acid. Those are both 18 carbon fats and SCD1 converts stearic to oleic by introducing a double bond. So the ratio is an indirect marker of SCD1 activity. SCD1 activity is an indirect indicator for the amount of de novo lipogenesis (making fat from starch) the organism is doing.
The DI16 is the same idea but for the 16 carbon fats palmitic acid and palmitoleic acid. The problem with the DI18 is that it can be thrown out of whack by dietary oleic acid. Dietary palmitoleic acid is usually less of a concern and so DI16 is actually a more consistent indicator.
The reason I haven’t focused on DI16 in the past is that it gives a small, fractional result. If I asked 10 people which number is bigger and by how much – 0.05 Vs. 0.1 – I’m not sure what percent would get it right. I suspect it’s less than 10. So the DI1600 is palmitoleic acid divided by palmitic acid multiplied by 100. Because I think most people know that 10 is twice as much as 5.
The Low Omega-3 Oil Pigs
The pigs given the high linoleic acid diet have an elevated DI1600 – 6.1 vs. 5.4 in controls- suggesting they are in the early stages of becoming torpid. On the other hand, they are exquisitely insulin sensitive – as demonstrated by low blood glucose in the context of very low fasting insulin.
We can see from their fat composition that they are not doing large amounts of lipogenesis. The main products of DNL in order are: oleic acid, palmitic acid then stearic acid. All three of these fats decrease in the linoleic acid fed pigs. They are replaced by linoleic acid, which pigs cannot make. These pigs are mostly getting fat from their diet.
The c-reactive protein (CRP) in the linoleic acid fed pigs dropped by a third compared to the control diet. CRP is an inflammatory marker.
A mainstream nutritionist might look at this data and say something like: linoleic acid increases insulin sensitivity by reducing inflammation.
But the signs of trouble are there. These pigs are perched on the edge of torpor but they haven’t quite gone over the threshold. In addition to the increase in DI1600, their free fatty acids and triglycerides have doubled and their HDL dropped. The inflammatory markers IL-6 and TNFa have also doubled. It’s actually not clear that they have lower overall inflammation.
A little ALA brings the torpor
The more easily oxidizable ALA brings on full blown torpor.. When an animal enters torpor it upregulates lipogenic genes and becomes insulin resistant3 in an effort to store fat. Are the pigs fed linoleic acid plus some ALA insulin resistant and doing DNL?
They have higher blood glucose in the context of massively higher insulin, so we can check the box on insulin resistance.
Their DI1600 increases to 7.9. Palmitic acid and oleic acid replace linoleic acid in their plasma fat – their fat is coming from DNL not diet. They are making lots of fat from the starch in the diet which is diluting out linoleic acid. So we can check the box on DNL.
These pigs also have other signs of metabolic syndrome compared to the low omega-3 group. Their LDL explodes from 0.9 to 4.7. Triglycerides increase another 50% and HDL plunges to less than half that of the control group.
Perhaps torpor and metabolic syndrome are two different words for the same thing.
Obesity: “Eat More, Move Less” or Fuel partitioning disease?
If you are a strict interpreter of CICO there is a mystery here. The pigs fed the diets containing the oils consumed around 40,000 calories more than the pigs fed the control diet over the 56 days. The pigs on the high fat diets should have gained between 6 and 7 kilograms more than the pigs on the control diet but this didn’t happen. There is no reason to think the pigs fed the vegetable oils exercised more. Where did the calories go?
If you believe that obesity is a disease of overnutrition leading to inflammation and insulin resistance,4 why did the pigs eating the low omega-3 oil become exquisitely insulin sensitive despite eating an additional 700 calories per day over the 8 weeks? There is no consistent relationship here between insulin sensitivity and inflammation levels. Why did the group of pigs who gained the most weight have the lowest CRP and significantly less TNF than the low omega-3 group? If the small rise in IL-6 is more important than the drops in TNF and CRP then why is the low omega-3 group so much more insulin sensitive than controls despite having twice the IL-6?
Another theory that bites the dust in this paper is the idea that the omega-6/omega-3 ratio is crucial for metabolic health. The torpid pigs had the “best” (lowest) ratio of any of the groups.
I believe that obesity is a fuel partitioning disease. The pigs who ate the extra calories didn’t gain the amount they “should have” – their metabolism would have adjusted to an increase in calories. The pigs who were very insulin sensitive (low omega-3 group) would have weighed a bit more because the extreme insulin sensitivity is allowing more fat into fat cells. The pigs who became torpid (ALA group) gained the most weight because they turned on DNL. They switched into “make and store fat” mode rather than “burn fat” mode. If your worldview is a fuel partitioning one then each tissue will be as fat as the underlying enzyme systems allow it to be. The dynamics of how the enzyme systems and feedback mechanisms change over time control fatness AND caloric intake. Animals who enter into torpor become hyperphagic – they overeat. Perhaps this is why the torpid group ate a few more calories than the low omega-3 group? The enzymes and hormones are driving the bus.
Firebrand Meats Low-PUFA Pork CSA
Bacon without the corn oil! Almost all american pork – conventional, organic, pastured or otherwise, is high in polyunsaturated fats. Firebrand Meats is the first American meat company specializing in making low-PUFA pork. It is a subscription based service that is shipping to all 48 continental states. It’s based on a CSA (community supported agriculture) model, which means we need a bunch of folks to sign up to get production started.
I wish it went longer
Of course the study isn’t perfect. I would very much like to see how this feeding strategy played out over 16 or 24 weeks or a year. Another question I’d like to see asked: Once pigs are torpid, what happens if you put them back on the control diet?
Get a hold of me if you want to help start a non-profit swine obesity research institute. I have the land and the know-how. I need a grant writer. Or donors. Or people who know donors and grant writers. Just putting it out there. I’m pretty sure that with the right funding and modern pig facility we could make huge headway in a few years.
- 1.Chawla AR, Spencer SM, Alloosh M, Byrd JP, Sturek M. AMP kinase mutation exacerbates electrocardiographic ST segment elevation in Ossabaw miniature swine during myocardial ischemia. FASEB j. Published online April 2011. doi:10.1096/fasebj.25.1_supplement.1099.6
- 2.Potu RB, Lu H, Adeola O, Ajuwon KM. Metabolic markers in Ossabaw pigs fed high fat diets enriched in regular or low α-linolenic acid soy oil. Nutrition & Metabolism. Published online 2013:27. doi:10.1186/1743-7075-10-27
- 3.Martin SL. Mammalian hibernation: a naturally reversible model for insulin resistance in man? Diabetes and Vascular Disease Research. Published online January 1, 2008:76-81. doi:10.3132/dvdr.2008.013
- 4.Lionetti L, Mollica MP, Lombardi A, Cavaliere G, Gifuni G, Barletta A. From chronic overnutrition to insulin resistance: The role of fat-storing capacity and inflammation. Nutrition, Metabolism and Cardiovascular Diseases. Published online February 2009:146-152. doi:10.1016/j.numecd.2008.10.010
Makes you wonder what kind of effects Vascepa is going to have?
AFAIK it can aggravate A fib. I suggest you visit the website/ blog of the Skeptical Cardiologist. and apparently does not protect Cvd and trials are suspect.
https://theskepticalcardiologist.com/2021/01/09/omega-3-fatty-acids-and-cardiovascular-disease-risk-has-the-story-ended-or-only-just-begun/
Hi Brad, I just did my OmegaQuant test and found I have a DI18 of 2.2 (just another data point for you in case you keep track). I’ve never been anywhere near “overweight” or at least “overweight in appearance” but my metabolism is definitely somewhat broken – tiredness, inflammation, skin problems, IBS, brain fog etc, the symptoms have been mostly fixed by adopting a carnivore diet 18 months ago. I’ve obviously been strictly avoiding PUFAs for the past 18 months and I’ve also tried to increase SA and butter in my diet after listening to some of your earlier podcasts.
I just calculated my DI1600 which came out at 5.1 and I’m wondering if you have any inkling as to what is a good range for this value in humans?
PS: I’ve subscribed to your newsletter but I haven’t received the last blog post in my inbox, not sure if this is how it’s supposed to work, just a heads up. Also loved your recent podcasts, keep doing your great work.
I just added A DI1600 row to the article where you can compare your DI. Unfortunately a lot of the studies didn’t report 16:1, so not a lot of comparisons. The French in 2014 were at 3.0. I am the current record holder at 12.
Hi Brad, Another fascinating post. On the Omega 3 question, is there a distinction to be made between ALA and DHA/EPA? I’d be surprised if getting a lot of omega 3 in the form of EPA/DHA from whole fish was problematic (for humans anyway). Historically, I’m not aware that coastal-dwelling human populations who consumed high amounts of EPA/DHA in the form of whole fish were fatter or more torpid or shorter-lived than their inland-dwelling cousins (e.g. see Weston Price’s book) The Japanese consume a lot of omega 3 from eating fish but have been lean historically. I might, however, be suspicious of fish oil, which is modern and new fangled. Interested in your thoughts on these questions.
I’ve been wondering about this and O3 in general.
For instance, I’ve been low carb/keto for about 7.5 years. The vast majority (all?) of the data showing O3 is beneficial is epi data, on high(er) carb folk. Epi data is notoriously bad, as it often is a marker of people, not things. In other words, people WHO EAT high O3 have better outcomes than those who don’t.
I theorize that O3 is less critical for those of us on low carb, as our inflammation is already really low. (My CRP for instance is almost always well below 1, though it varies a lot.)
As for people who eat fish, that’s difficult, as it’s hard to tell how much O3 they are getting. If Brad’s U-shaped curve theory is correct, they might never get to the part of the U that goes up.
Personally, I think that generalizations like “The Japanese eat…” or “The French eat…” are troubling. Japan and France are large countries, and I would assume what they eat varies wildly over the country.
Also heard an interview with Dr. Ben Bikman, where he said that there are differences in indications of metabolic syndrome for populations. He gave the example of European versus Asian descent. He thought that a European could gain proportionally more fat mass than Asians for the same amount of metabolic derangement. In other words, a male of European descent could gain 50 pounds (a made up example) and only be mildly metabolically deranged, while an Asian might gain 10 pounds and have worse metabolic derangement. The Asian still might be “thin” by our standards, but would be worse off.
I did find the insulin values to be shocking. As humans, a 1.7 is ridiculously low, but the animal is not in great shape.
So, don’t eat salmon?
https://theskepticalcardiologist.com/2021/01/09/omega-3-fatty-acids-and-cardiovascular-disease-risk-has-the-story-ended-or-only-just-begun/
Re HAP’s link, the skeptical cardiologist’s main conclusion s that there’s no strong evidence that omega 3 protects against heart disease. He doesn’t distinguish between fish and fish oil in his analysis (he uses the terms interchangeably) And he doesn’t say that omega 3 causes harm at high levels , just that it does not protect against heart disease..
Brad is saying that omega 3 may cause harm (metabolically) at high levels (U-shaped curve etc). Look forward to further musings from Brad as to whether this harm is just from ALA, or might also be from EPA/DHA . And whether omega 3s from fish and fish oil might be equally suspect.
Interesting. I guess pigs don’t eat a lot of stearic acid so their DI18 would be difficult to compare to humans. FWIW my DI1600 is 8.9 and DI18 is 1.6.
It would be really interesting to get some fit/athletic people to contribute their DIs for science. Lots of the carnivore crowd are sciencey folks, and many long-term adherents seem to be quite fit. Surely they would consider it?
The only thing that “confounded” me was the complete lack of corn syrup given to the control group. I wonder how that could have effected the outcomes? The control groups liver had to process very little if not zero fructose whereas the high fat pigs did. 30-40g of fructose from the 60g of corn syrup doesn’t sound like much, but that is a considerable amount when taking the weight of the pigs into account.
Given the assured metabolic dysfunction the PUFA’s cause, was the fructose metabolism more fuel to the fire that exacerbated the negative outcomes?
I wonder what the thought process was to withholding that dietary input for the researchers?