
There are great tales in the medical literature if you look for them. In the 1930’s – the early days of metabolic research – a sort of North-South challenge presented itself. An SEC-Big 10 challenge of metabolic rates (For those who are not American college football fans, the SEC is a Southern Conference and the Big 10 a Northern one and they play each other each year) amongst young college women.
The issue was that basal metabolic rates (BMR) in college women in the South were consistently 10-15% lower than of college women in the North.
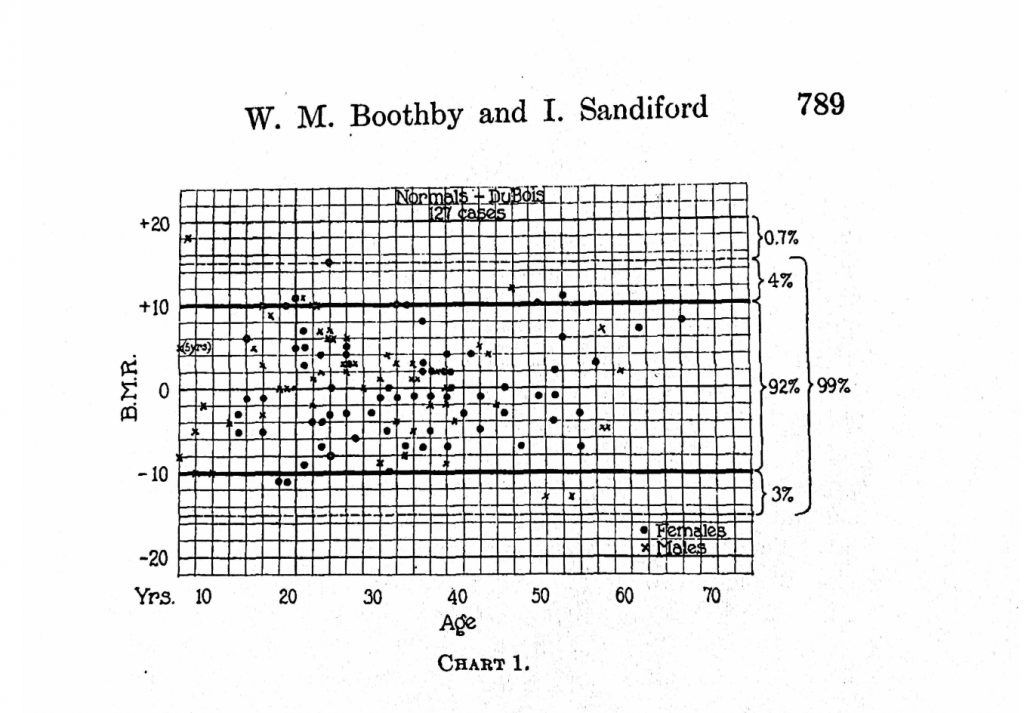
Several equations for predicting basal metabolic rate based on height, weight, gender and age were published before 1920, most prominently the Harris-Benedict equation1 – developed at Wellesley college in Massachusetts – and the DuBois equation2 – developed at Weill Medical college in New York City. In 1922, Walter Boothby and Irene Sandiford published, “Summary of the basal metabolism data on 8,614 subjects with especial reference to the normal standards for the estimation of the basal metabolic rate.”3 This was a large study done in Minnesota showing that indeed, the DuBois and Harris-Benedict equations correctly predicted the basal metabolic rates of normal, healthy adults to within plus or minus 10 percent.
I particularly enjoy the handmade graphs from this paper. The middle line represents people whose BMR are perfectly predicted by the specified equation. The top dark line is people whose BMR is 10% higher than the equation predicts and the lower dark line is people whose BMR is 10% lower than the equation predicts. As you can see, 90% of all people fall within the dark lines and those who fall outside of it don’t do so by much.
Look at the PENMANSHIP!!!!
A Discrepency In The South
Then in 1930, Jennie Tilt wrote this in “The basal metabolism of young college women in Florida.”4
This is a deviation from the prediction of -9.9 per cent (HarrisBenedict) and – 10.6 per cent (Aub-Du Bois). If it is accepted that the standards for women should be lowered by about 5 per cent, the average metabolism of this group still is lower than the normal limits. By the Harris and Benedict prediction there are only two whose metabolism is above the predicted and three by the Aub and Du Bois prediction. All the others are below. It is interesting to note that by the Harris and Benedict prediction thirty, or 58 per cent, of the group are below -10 per cent; twenty-eight, or 54 per cent, are below by the Aub and Du Bois prediction. All the very low results were repeated several times so that we feel quite confident that the figures represent basal values. It would thus seem that there is some evidence that the basal metabolism of southern college women tends to be lower than that predicted for young women of the same age and living in the north.
More than half of the Florida women had metabolisms below the dark lower line – 10% below the prediction of the Harris-Benedict or DoBois equations. This is opposed to less than 5% of the women in Minnesota.
In 1931 Callie Mae Coons, studying young woman in Oklahoma, reported:5
Deviation from the Du Bois (1927) standard varies from – 15.5 for the youngest group to -10.6 per cent for the 25-29 age group. Although some groups are small, it will be noted that four out of the seven groups average a deviation very close to – 14 per cent, – 13.2 per cent being the average for all ages. 86 per cent of the 18 year old group and 71 per cent of the entire number are below the – 10 per cent limits of the Du Bois predictions, and 37 per cent below the – 15 per cent limits. These facts emphasize the inapplicability of present standards to Southern women.
So 37 percent of the women in Oklahoma had a metabolic rate more than 15% below the standard as opposed to none of the women in Minnesota.
South Carolina, 1931:6
Determinations of basal metabolism on ninety-three student nurses and forty male medical students at Charleston, S. C, showed results averaging about 10 per cent lower than the Aub-Du Bois standard. Climate, the relative amount of iodine in human environment, dietary habits, and the state of nutrition are not considered responsible for the low values obtained.
Tilt published another study of Florida women in 1935:7
1. Basal metabolic rates were determined on a group of thirty normal young women who have lived in Florida 8 years or longer. The average deviations calculated from pre diction standards were: Aub-DuBois, modified by Boothby and Sandiford, -14.1 per cent; Harris-Benedict, -13.0 per cent.
2. Basal metabolic rates were determined on a group of 8 young women who had recently come from northern states. The average deviations were – 7.7 per cent from the modified Aub-DuBois standard, – 7.8 per cent from the Harris-Benedict (extrapolated).
3. A comparison of the average basal metabolism of young women living in Florida with those from northern states shows a decidedly lower rate for Florida women.
4. A 4-day dietary study on eighteen young women of the group living in Florida showed an average intake of 1.23 gm. protein and 39.9 calories per kilogram of body weight per day. The protein was of good quality.
5. No consistent relationship was noted between basal metabolism and protein or calorie intake.
New Orleans, 1939:
A comparison of observations on 160 men and women with the usual standards suggests that a statistically valid standard for New Orleans, and possibly other southern regions, would be obtained by deducting 10 per cent. from the Aub-Du Bois values.
Then in 1939, a paper from the University of Connecticut8 (a Northern state) was published, reaffirming that yes, indeed women in the South had lower metabolic rates:
The average basal rate of the Connecticut State College women was found to be -2.3 Aub-DuBois; -1.9 HarrisBenedict. The excellent quality and quantity of food may be a factor in producing a relatively high average.
So metabolic rates in New Orleans, South Carolina, Florida and Oklahoma ranged from 10-14% below the DuBois and Harris-Benedict standards, whereas women from Connecticut were only 2% below the standard.
Factors In Metabolism
The main factors suggested for this difference in metabolic rates at the time were food quality – especially protein, iodine content of the food – affecting the thyroid, and climate.
Th 1935 Florida paper brings into doubt that protein quantity or quality or caloric consumption are affecting metabolic rate.
From a study of table 4 which summarizes the average daily intake of each individual, it is noted that most of the diets were quite adequate from the standpoint of grams protein and total calories. … The quality of the protein consumed appears to be quite adequate for meat, milk, and eggs were well distributed throughout the diets. … There does not appear to be any definite parallelism between protein and calorie intake and basal metabolism.
The South Carolina paper points out that iodine levels are higher in the South and especially South Carolina than the rest of the country.
The widely quoted studies of Olesen on men drafted for military service in the United States showed that enlarged thyroids are least common in the southeastern part of the country. Systematic examinations of school children have been made in many places where goiter is known to be endemic, and there are schools in some parts of the country where practically every child has an enlarged thyroid. Examinations usually have not been made in areas where goiter is not a problem, although Hayne 9 reported the results of the examination of 17,600 school children by county health officers in twenty counties of South Carolina. … practically all standards of metabolic rate have been developed in regions where goiter is more common than it is in South Carolina … From this point of view the results are disappointing, as they show values for both men and women around 10 per cent below those of the Russell Sage Institute or the Mayo Foundation.
Climate
Climate is the thorniest question to disentangle. The argument is that people in a warmer climate need to do less thermogenesis to stay warm and therefore lower their metabolic rate. The first obvious problem in this data set is that the metabolic rates in Oklahoma were equally low as those in Florida even though Oklahoma is much colder than Florida.
Another problem with this idea is that Benedict himself had travelled to the Yucatan Penninsula in 19289 and found that Mayans had a BMR 5.2% above the rate predicted by his own equation. A 1931 follow up trip10 found that Mayans had a rate 5.8% higher than his equation. So people in a tropical climate don’t necessarily have a lower metabolic rate.
A 1941 paper11 found that Europeans (the college students being studies in all of these experiments in the segregated South of the 1930’s are presumably of European descent) living in a tropical climate had a decline in metabolic rate of 5.7% compared to the Harris Benedict standard and 6.3% compared to the DuBois standard. So there was a decline but nothing like the 13-14% declines seen in Oklahoma and Florida.
The most compelling argument from today’s perspective that the difference in metabolic rates was not due to climatic differences is that today everyone in the US has the metabolic rates of 1931 Oklahomans or 1935 Floridians, regardless of their latitude. For instance, this 1985 paper12 found that women at the Memorial Sloan-Kettering facility (New York City) had metabolic rates 13.5% below that predicted by the Harris Benedict equation whereas women at the Emory (Georgia) facility were 10.9% below prediction – lower metabolic rates in the North!
Unsaturated Fat
I’ve argued on this blog that unsaturated fat lowers metabolic rate. My argument is summarized in ROS as a NAD+ Regenerating, Thermogenic Cycle and Obesity as a Global Succinate Dehydrogenase Activity Deficit. For this to possibly explain the discrepancy between Northern and Southern metabolic rates we’d need to know that there were large regional differences in types of fat consumed in the 1930s.
The USDA 1939 Yearbook of Agriculture presents this table in the article “Present-Day Diets In The US”. “Other fats, oils and fatty foods” are defined as “lard and lard compounds, vegetable oils, margarines, bacon, and salt pork”.

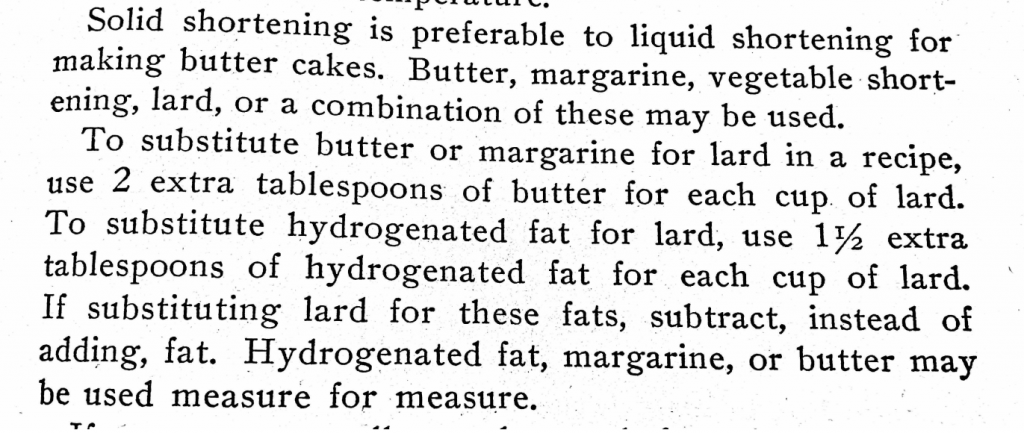
Helen Worth’s 1943 “Down-On-The-Farm cookbook” is matter of fact about the ability to swap out butter for margarine, other hydrogenated vegetable oils or corn-finished lard and mentions liquid vegetable oils. All of these substitutions would have increased polyunsaturated fat content. All of these were in wide use and part of the “other fats”.
Combining the data from the USDA in 1939 and data from FAOSTAT, we get a table like this:
| Butter (lbs/yr) | Other Fats (lbs/yr) | Metabolic Rate | |
| Connecticut Women 1939 | 21 | 11 | -2% |
| Southern Woman 1930s | 8 | 41 | -10 to -14% |
| American Women, 1985 | 4.8 | 51 | -10 to -14% |
Summary
In the 1930s Southern Women were eating more unsaturated fats than Northern Women and had lower metabolic rates. By 1985, American women everywhere were eating lots of unsaturated fat and had uniformly low metabolic rates. At the very least, a theory of obesity should have some predictive value in the real world. The idea that metabolic rate is partially controlled by the degree of fat saturation has predictive value in this instance.
Metabolic rates have dropped since the 1930s in parallel with penmanship and the rise in vegetable oil consumption.
- 1.Harris J, Benedict F. A Biometric Study of Basal Metabolism in Man. Carnegie Institution of Washington; 1919.
- 2.GEPHART FC. CLINICAL CALORIMETRY. Arch Intern Med (Chic). Published online June 1, 1916:902. doi:10.1001/archinte.1916.00080130054005
- 3.Boothby WM, Sandiford I. SUMMARY OF THE BASAL METABOLISM DATA ON 8,614 SUBJECTS WITH ESPECIAL REFERENCE TO THE NORMAL STANDARDS FOR THE ESTIMATION OF THE BASAL METABOLIC RATE. Journal of Biological Chemistry. Published online December 1922:783-803. doi:10.1016/s0021-9258(18)85715-5
- 4.Tilt J. THE BASAL METABOLISM OF YOUNG COLLEGE WOMEN IN FLORIDA. Journal of Biological Chemistry. Published online April 1930:635-641. doi:10.1016/s0021-9258(20)78931-3
- 5.Coons CM. THE BASAL METABOLISM OF OKLAHOMA WOMEN. American Journal of Physiology-Legacy Content. Published online November 1, 1931:692-697. doi:10.1152/ajplegacy.1931.98.4.692
- 6.REMINGTON RE. BASAL METABOLIC RATE OF MEDICAL STUDENTS AND NURSES IN TRAINING AT CHARLESTON, S. C. Arch Intern Med. Published online March 1, 1931:366. doi:10.1001/archinte.1931.00140210029002
- 7.Tilt J, Walters CF. A Study of the Basal Metabolism and Diet of Normal Young College Women in Florida. The Journal of Nutrition. Published online January 1, 1935:109-117. doi:10.1093/jn/9.1.109
- 8.Rogers EC. Basal Metabolism of Connecticut State College Students. The Journal of Nutrition. Published online August 1, 1939:195-203. doi:10.1093/jn/18.2.195
- 9.Williams GD, Benedict FG. THE BASAL METABOLISM OF MAYAS IN YUCATAN. American Journal of Physiology-Legacy Content. Published online July 1, 1928:634-649. doi:10.1152/ajplegacy.1928.85.3.634
- 10.Shattuck GC, Benedict FG. FURTHER STUDIES ON THE BASAL METABOLISM OF MAYA INDIANS IN YUCATAN. American Journal of Physiology-Legacy Content. Published online March 1, 1931:518-528. doi:10.1152/ajplegacy.1931.96.3.518
- 11.Macgregor RGS, Loh GL. The influence of a tropical environment upon the basal metabolism, pulse rate and blood pressure in Europeans. The Journal of Physiology. Published online June 30, 1941:496-509. doi:10.1113/jphysiol.1941.sp003918
- 12.Daly JM, Heymsfield SB, Head CA, et al. Human energy requirements: overestimation by widely used prediction equation. The American Journal of Clinical Nutrition. Published online December 1, 1985:1170-1174. doi:10.1093/ajcn/42.6.1170
I found this post particularly fascinating.
My husband and I moved to Florida from Canada a few years ago, and he moved from Europe to Canada about 10 years before that.
There are “fat people” in both Canada and Europe (I was an overweight kid growing up in the 80’s and 90’s full of my mom’s default margarine instead of butter myself), but the degree of disfiguring obesity we see here in the South is astonishing. It’s like nothing seen elsewhere.
There are also several observable autoimmune and hormone issues we see in people around here regularly (daily) that were diseases we had heard of but never seen before in person. Vitiligo and Lipedema come to mind. Psoriasis and Eczema, too, are magnitudes worse here than we have ever seen in our lives prior to moving here.
My husband and I have often wondered what the “x factor” that allowed such obesity and related issues to form here versus in Canada. Genetics? HFCS? FWIW, In Canada, our default oil is Canola – not good, but not as bad as the default Soybean and Corn oils here. In fact, if you consider that Canola is 30% Linoleic Acid while Soybean is about 70%, then Canada will be about half as badly off, on average, as Americans. This does seem to be anecdotally reflected in the living breathing people in both places.
It also means that the American South is potentially a very real foreshadowing of what is to come for the rest of the world as people move away from real foods… especially with the disturbingly misdirected Vegan agenda that is being relentlessly pushed upon us.
By the way, an update on our own situation:
All markers in our OmegaQuant tests have improved as of yesterday (since our last tests done in November) and my DI has dropped by 0.3! My PUFA better than halved in 4 months. Hubby did well with his fat balances but not NEARLY as well as I did. Our diet has been 100% TCD compliant, and almost exactly the same as each other (since I feed us all of our major meals) except for two key differences between us:
1. He has a bit of a sweet tooth so whereas I’ll regularly double my rice/pasta portion, he’s far more likely to grab a (compliant ingredient) cookie/pastry or have milk chocolate instead of the 85-90% dark chocolate that I choose every now and again. So sugar quantity itself, and sugar vs starch, does seem to matter.
2. I have been drinking Pu-erh Tea throughout the day most days, and have been taking 1000mg of Metformin every evening. He has not done either.
My body temperature is consistently higher (sometimes even 98+ first thing in the morning!) and while my scale weight hasn’t dropped lately, I’m EFFORTLESSLY maintaining the low I achieved months ago on 4000+ cal/day regularly. I eat as much as I want. The more I eat, the higher my body temp goes for longer (and the higher the temp is the following morning) AS LONG AS I really pay attention to the fat:carb ratio and keep it at a comfortable 50%+ Fat and <25% Carb. If I start getting too rice/pasta/potato happy, or choose sugary Asian sauces over cream sauces, it doesn’t seem to work as well for me, and my husband’s extreme hypoglycemic symptoms return – albeit MUCH lessened versus when we were consuming abundant PUFA before.
Thanks again for the work you do. I quite literally found this blog through Divine intervention… So you’re truly a God-send. 😉
Thanks for the update and the interesting thoughts!
Great post. I thought the climate piece would be a factor as would protein consumption. The fact that protein was relatively normalized and the Mayans in the Yucatan didn’t show the drop really shot those arguments down. Well done.
Good stuff. Were there any odd counter-examples in the data you found? Higher PUFA but higher metabolic rates?
Not really. Starch eating cultures are consistently the highest. There are some weirdly low metabolic rates from a couple studies in Africa, but I assume that’s related to food shortage.
Your capacity to chase down these arcane studies, and especially the historic piece is very impressive. I always look foreword to what you have recently published. Good work.
Very cool observation. You could honestly say the obesity epidemic orginated in the South, probably because cottonseed oil was the first mass-produced high-PUFA vegetable oil. And obviously, the American South was/is a huge producer of cotton.
Here’s a quick video I made on the topic, with the focus on whole-body rather than cellular metabolism: https://vm.tiktok.com/ZTd5w8tuu/ (I don’t really buy into the “lipostat.” But it’s interesting, and to whatever extent you do believe in it, PUFA definitely breaks it.)
To be honest this is one of the main point développer by Ray Peat in some article explaining explosion of modern disease (blood/heart censure) since introduction of vegetable oil into animal diet and human diet. This article is proving the same.
I was just on a panel with Dr. Peat where he said the same. The panel discussion prompted me to finally write this series. My ideas differ from his since I think the enzyme NNT and ROS generation play a central role in all of this.