On this blog I have argued that:
- The traditional French diet combining starch and saturated fat results in leanness
- The richest, least active American men stayed lean on 4500 calories per day in the 1930s
- Metabolic rate is correlated to saturation level
- Obese humans have very unsaturated body fat
- The metabolic rates of Americans dropped between 1919 and 1990
- The body temperatures of Americans has dropped over the past 150 years
- Consumption of PUFA results in a torpid metabolism
- The gatekeepers of torpor are the nuclear receptors PPARy and the AhR
- The torpid metabolism is defined by high expression levels of the enzyme SCD1 and high percentage of monounsaturated body fat
- The muscle tissues of obese humans are characterized by high SCD1 expression, low metabolic rate and low levels of oxidative fiber types
- Conversely, mice who lack the gene SCD1 display hypermetabolism and a lean phenotype
- The adipose tissue of obese humans has a low metabolic rate
- The low metabolic rate of obese humans is characterized by the inability to stimulate AMPK and SIRT1 together
- Low SIRT3 activity, due in part to lack of SIRT1 activity, leads to acetylated (turned off) mitochondrial enzymes such as citrate synthase and complex 1, keeping metabolic rates low
I have long thought the mechanism that tied these observations together was that unsaturated fats – dietary linoleic acid and SCD1 generated oleic acid – have a low FADH2:NADH ratio and therefore fail to drive ROS production at the mitochondrial bottleneck. Not a lot of groups study ROS in the context of obesity, however, and so definitive proof was missing.
Three papers have come out since 2020 that – while still short of definitive proof – paint a convincing picture that ROS is the underlying cause. I’m going to talk about the first two papers in this, part 1. The next article will discuss the third. I’ve also been working on a biohack that I think has huge potential, so stay tuned for that.
What limits our metabolic rate?
From the perspective of Oxygen, fat is very electron rich. When fat is delivered to the mitochondria by CPT1, its electrons are stripped away and sent down the electron transport chain. It is broken down into acetyl-CoA, which fuels one turn of the citric acid cycle. Every turn converts three molecules of NAD+ to NADH. NADH hands its electrons to Complex I, the first step of the electron transport chain, which converts the NADH back to NAD+.
The electron transport chain pumps protons across the mitochondrial membrane, creating a voltage gradient. As the voltage gradient gets higher, the electrons don’t move as fast. The protons are returning to the mitochondria through mitochondrial complex V, which converts ADP to ATP.

But we’re lounging. Demand for ATP isn’t terribly high. Very quickly the pool of ADP will be converted to ATP, creating a low ADP/ATP ratio. There is nowhere for the protons to flow to. The voltage gradient steepens, making it harder to push electrons through Complex I. If the citric acid cycle continues to turn, converting NAD+ to NADH, and if the rate at which NADH can hand its electrons to complex I slows, very quickly we will end up with a low NAD+/NADH ratio.
This is a state known as reductive stress. It means that all of the electron carrying molecules – NADH and ATP (indirectly) – are already carrying electrons. There is literally nowhere for electrons to flow to until some more ATP is burned.
Of course the body has feedback loops built in to deal with this situation. With nowhere for electrons to flow to, the pool of acetyl-CoA grows. As the pool grows, some of it is converted to malonyl-CoA, which blocks CPT1 and slows the flow of fat into the mitochondria. The acetyltransferases, which acetylate mitochondrial Complex I and V and citrate synthase and turn them OFF, use acetyl-CoA as the source of acetyl groups. Acetylation happens at a faster rate.
SIRT3, the mitochondrial deacetylase, is NAD+ dependent. There is little NAD+ to be found and so mitochondrial enzyme acetylation increases and metabolic rate slows.
This situation actually describes human obesity quite accurately. Reductive stress as defined by low NAD+/NADH ratio, acetylated mitochondrial enzymes1 and low metabolic rate of fat2 and muscle tissues3.
Saturated fat makes NAD+
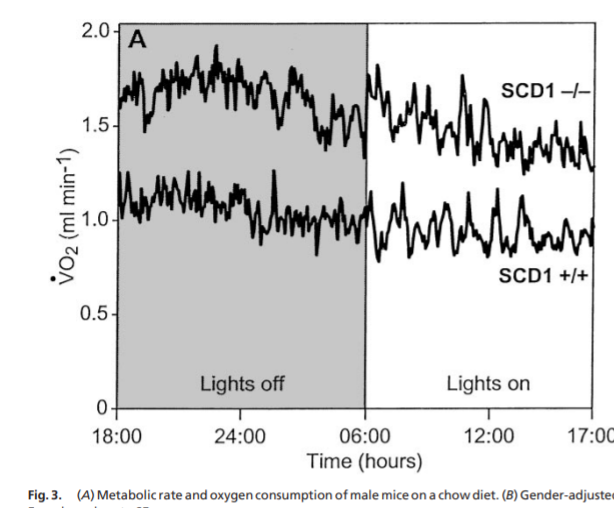
The first paper is a 2020 paper by Ntambi’s group. Ntambi will be a first ballot inductee when we launch the Fire In A Bottle hall of fame. He has led the way on SCD1 discovery and ongoing research. Mice lacking the gene SCD1, which converts saturated fat to monounsaturated fat, have a very saturated fat, a very high metabolic rate and remain lean.
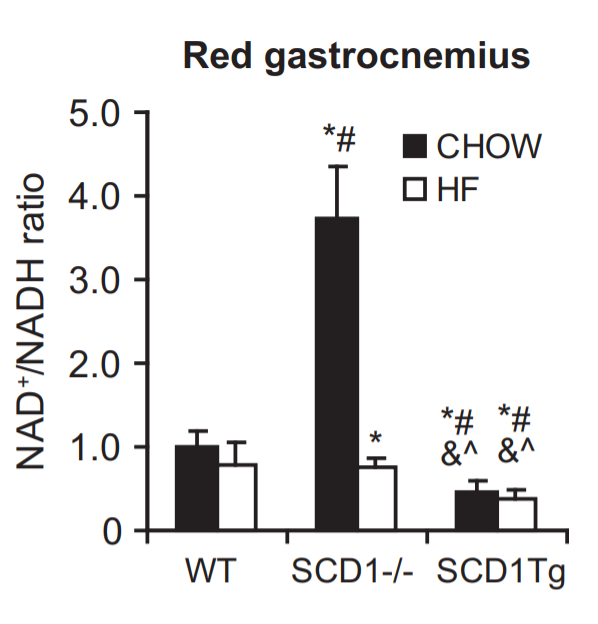
The new paper showed that mice lacking SCD1 eating a low fat control mouse diet have a huge increase in NAD+ and AMP/ATP ratio compared to wild type mice! Furthermore, in mice where SCD1 is selectively overexpressed in muscle tissue (and therefore have unsaturated fat) – the mice labelled SCD1Tg – the NAD+/NADH and the AMP/ATP ratios both plunge!
Let’s think first about the mice lacking SCD1.
An increase in AMP/ATP ratio along with an increase in NAD+/NADH will stimulate AMPK, SIRT1, SIRT3 and PCG-1a and lead to a high metabolic rate. These mice are hypermetabolic.
I’m not surprised about the rise in AMP/ATP ratio. Mice lacking SCD1 have very saturated fat and therefore will produce more ROS (more about this later in the article) and ROS is known to directly affect the AMP/ATP ratio5. I recently speculated on why this might be.
The increase in NAD+ is even more interesting and goes a long way towards explaining the high metabolic rate of SCD deficient mice. High NAD+ will mean their mitochondrial enzyme remain unacetylated and ON. Activated AMPK and SIRT1 together will activate PGC-1a and therefore thermogenesis. But why the increase?
I’ve long suspected that the increased metabolic rate from SCD1 deficient mice was ultimately due to ROS generation because the fat is more saturated. Now we know that eliminating SCD1 creates more NAD+. Could this be due to ROS production?
The only clue I had was that I knew that eliminating ROS created NADP+. Superoxide is rapidly converted to hydrogen peroxide (H2O2) by superoxide dismutase and hydrogen peroxide is turned back to water by reduced glutathione, leaving us with an oxidized molecule of glutathione.
Glutathione cannot convert another molecule of hydrogen peroxide to water in the oxidized state. An enzyme called glutathione reductase reduces it back to reduced glutathione and in the process it converts a molecule of NADPH to NADP+. You might be thinking that NADP+ sounds a lot like NAD+ and you’re right – the only difference is a phosphate group. Both NADH and NADPH are reduced electron carriers. NAD+ and NADP+ are the oxidized versions.
If there were an enzyme that could convert NADP+ to NAD+, it would suggest that the source of NAD+ in the SCD1 deficient mice was indeed coming from the NADP+ generated from eliminating extra ROS created by higher fat saturation.
The Second Paper
A 2021 paper6 confirms that not only is this the case, but also that energy is used in the process. It’s a thermogenic cycle!
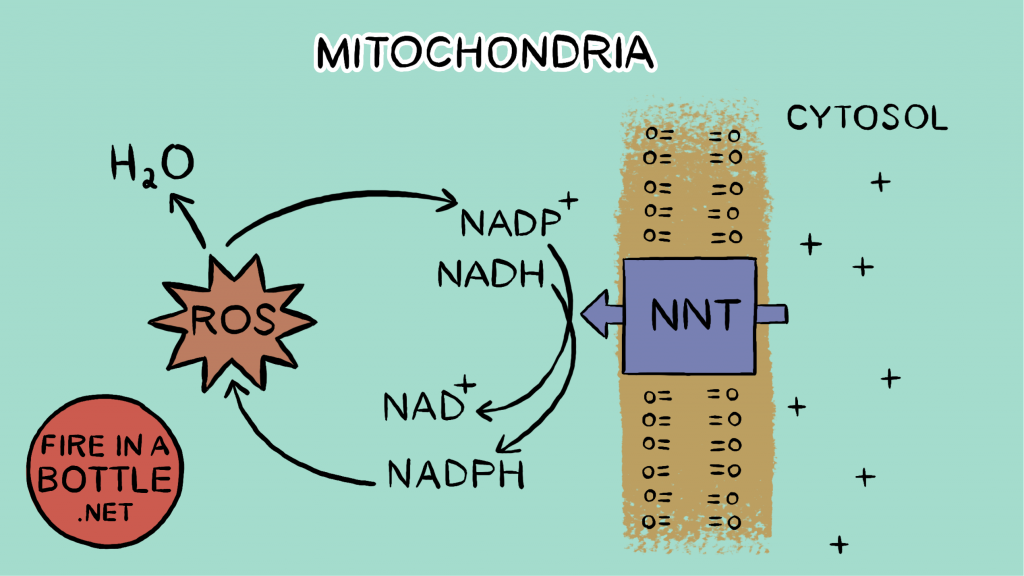
Nicotinamide nucleotide transhydrogenase (NNT) is a mitochondrial enzyme that crosses the inner membrane. It transfers a hydride ion (H-) from NADH to NADP+, taking in NADH and NADP+ and releasing NAD+ and NADPH. In fact, maintaining a pool of NADPH for the purpose of reducing the buildup of hydrogen peroxide is strongly prioritized over maintaining a pool of NADH. There are several pathways that can regenerate NADPH from NADP+, but the main thing that regenerates NADPH is NNT.
So every molecule of ROS that is generated gives us back an NAD+! And it gets better!! The reaction of transferring the hydride ion from NADH to NADP+ is unfavorable energetically. NNT actually uses the voltage gradient to perform the reaction, allowing protons back through the membrane. So eliminating a molecule of H2O2 both reduces the voltage gradient and gives us back an NAD+.
The NAD+ of course activates SIRT3, which keeps our mitochondrial enzymes deacetylated. It also gives electrons somewhere to flow to – reducing reductive stress, and since the gradient is lowered electrons can flow through the electron transport chain more easily. This reduces the acetyl-CoA pool, which activates CPT1, and reduces the fuel available to the acetyltransferases that acetylate the mitochondrial enzymes. Fat can be burned again!
This is thermogenesis! The cycle of electrons forming superoxide through reverse electron transport which then require energy to convert an NADH to an NAD+ releases heat but does no work.
The effect of this seems biologically relevant.
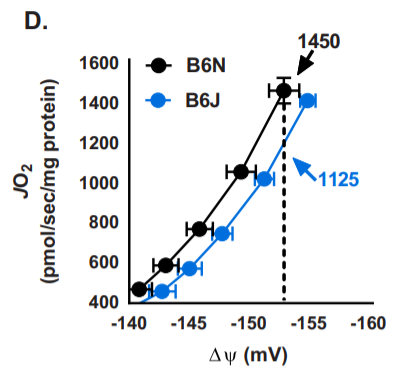
Most of what we know about NNT comes from studying C57Bl/6J (B6J) mice, the most popular mouse strain used in lab experiments on obesity because they reliably fatten on a high fat diet. B6J mice lack a functional NNT gene. A JBC comment7 on the article states: “Notably, oxygen consumption was 18.6% lower in B6J samples. Therefore, a significant fraction of mitochondrial respiration supports NNT activity in mediating an optimal rate of ROS removal.”
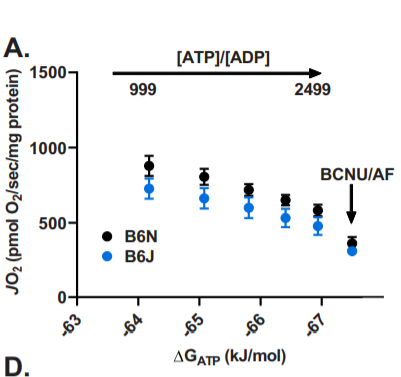
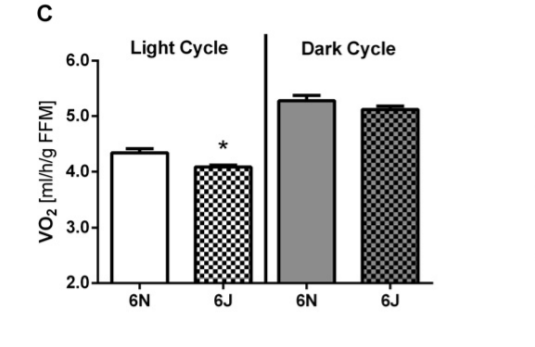
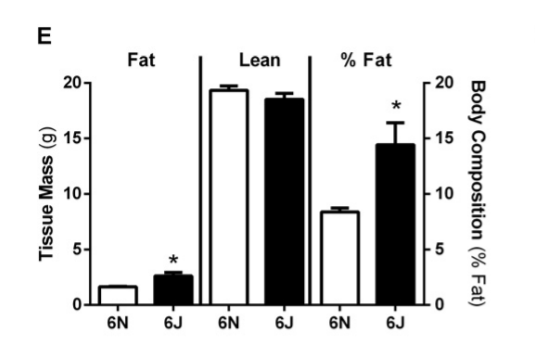
The B6J strain of mice has a lower metabolic rate after adjustment for Fat Free Mass than the closely related C57Bl/6N strain during the day, when the mice are sleeping and burning stored body fat.
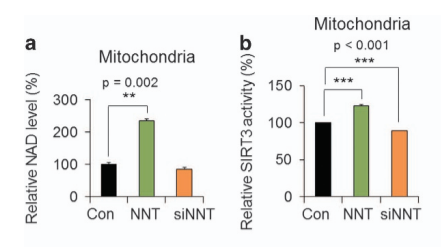
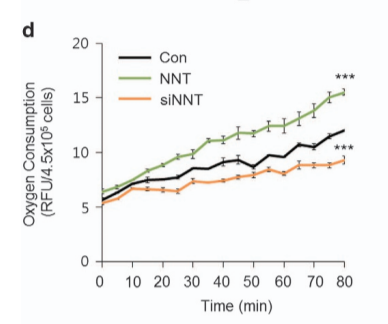
Additional evidence: a 2017 paper in glioblastoma tumor initiating cells showed that overexpressing NNT in the cells (green bars) increased NAD+ concentration, resulting in increased SIRT3 activity and significantly increased metabolic rate. Alternatively, using an antisense RNA to reduce expression of NNT (orange bars) resulted in less SIRT3 activity and lower metabolic rate. The metabolic rate of these cells is directly controlled by NNT level and therefore how much NAD+ can be generated.
Dietary and body fat
The mice lacking SCD1 on the low fat diet producing tons of NAD+ were burning their own very saturated body fat. Although they don’t have a lot of fat, they DO burn what they have, dropping to a respiratory exchange ratio (RER) of around 0.82 while they sleep during the day10. This indicates that they are getting 55-60% of calories from fat while they sleep. These mice get very little dietary fat, so they mostly burn body fat.
The mice on the high fat diet get 60% of their calories from their diet. They are probably doing very little de novo lipogenesis since there is plenty of PUFA in their diet and since they lack SCD1, which is a huge contributor to controlling the rate of lipogenesis. The fat they are burning, therefore, will closely resemble their dietary fat, which is plentiful.
Let’s compare the two. The dietary fat is 91% hi-PUFA lard and 9% soybean oil. I recently sent fat rendered from some Smithfield bacon in for testing as part of my Firebrand Meats low-PUFA pork project, so I’ll assume the lard used in the mice diets is the same as that.
| Liver Fat SCD-/-11 | Dietary Fat | |
| Palmitic Acid (SFA) | 58.8 | 20.6 |
| Stearic Acid (SFA) | 14.7 | 9.1 |
| Oleic Acid (MUFA) | 6.4 | 37.8 |
| Linoleic Acid (PUFA) | 19.0 | 18.8 |
As you can see, there is a huge drop in the two saturated fats – palmitic acid and stearic acid – between the body fat and the dietary fat. The linoleic acid PUFA is the same. More than half the saturated fat gets replaced by monounsaturated fats, resulting in a MUFA:SFA ratio of about 1.27:1
A recent paper12 gives some insight as to how ROS production changes in a real life situation. I like this paper because it is done in intact rat muscle fibers. This is very real world. As close as you can get in this kind of test anyway. Many of these studies are done in isolated mitochondria. This is at least in a living cell. These rats presumably contain a functional NNT gene. The ROS we see, to be clear, is not how much is produced, it’s how much builds up over 16 hours. The mitochondrial ROS system eliminates 80% of ROS before they can escape. So ROS buildup does not equal production but it’s an indicator.
All rat muscle cells are incubated with 5mM glucose and when palmitate (saturated fat) is present (white bars) it is at 0.4 mM. The unsaturated fats are steadily increased until they slightly exceed the amount of palmitate. The black bars are glucose plus the indicated amount of unsaturated fat. The white bars are with the palmitate. Notice that the scale is higher on the right hand graph.
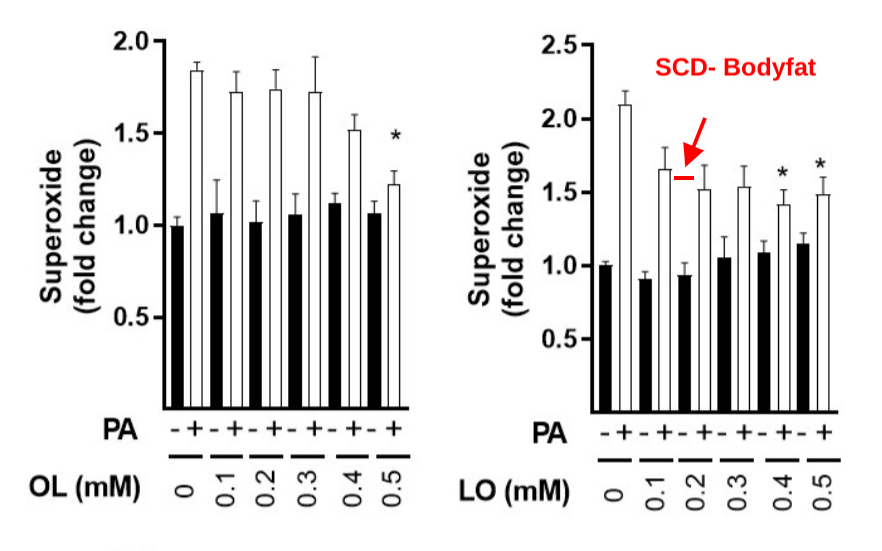
Let’s look at the oleic acid (OL, left hand side) first. The first black bar is glucose with no added fat. Oleic acid on its own – ignore the white bars for the moment – never induces any significant ROS buildup above those produced by glucose. The first white bar is glucose plus palmitate. ROS levels double. This is bad for the cells but of course there is no source of pure palmitate in nature so this is of no biological importance. The amount of oleic acid doesn’t have an effect on ROS buildup until it is equal to the amount of palmitate – a 50:50 blend. This creates about 50% more ROS than glucose alone. Add a bit more oleic acid and the amount of ROS buildup is down to 20% above glucose. Interestingly, oleic acid at 0.5nM is a MUFA:SFA ratio of 1.25:1, just about the same as the dietary fat of the high fat fed mice.
Now let’s look at linoleic acid (LO, right hand side). Linoleic acid, with it’s extra double bond, brings down the ROS production of palmitate much more quickly. By the time that linoleic acid is half that of palmitate it brings ROS buildup down to 50% more than glucose alone. But then it plateaus. Interestingly, linoleic acid alone does not produce more ROS than glucose in small amounts but as the amount increases, there is a small increase above glucose alone. I’m not sure why this is, the dynamics here are very complex and depend on CPT1, acetyl-CoA levels, etc.
I’ve drawn a red bar indicating where the body fat of the mice lacking SCD1 on a low fat diet falls on this graph. Their fat is a nearly pure mix of saturated and polyunsaturated fat and would presumably lead to a 60% buildup of ROS over baseline if used in this experiment. The dietary fat based on the SFA:MUFA ratio would produce maximally 20% over baseline but then that whole blend is diluted down further with 20% linoleic acid, so I’m guessing it would produce 10% more ROS than glucose or less.
Stated simply: the dietary fat of the high fat diet fed mice is no more ROS-forming than is glucose.
Look again at the NAD+/NADH chart from the first paper at the middle white bar from the SCD-/- mice fed the high fat diet. The NAD+ levels of the mice fed 60% non-ROS forming dietary fat drops back to baseline. There is little NADPH+ being generated by glutathione reductase to replace the NAD+ pool. Unsaturated dietary fat is sufficient to cause reductive stress.
Now look at how body fat composition in America changed between 1962 and 1991. The ROS-forming ability of the body fat of the 1991 American would have been even less than the dietary fat of the high fat fed mouse!
| Starch Eating Human13 | American Body Fat 196213 | American Body Fat 199114 | |
| Saturated (SFA) | 40.4 | 35.7 | 24.4 |
| Monounsaturated (MUFA) | 50.1 | 56.6 | 54.5 |
| Polyunsaturated (PUFA) | 8.7 | 8.1 | 21.0 |
SCD1 Overexpression Eliminates NAD+
As I said, the mice on the right of the NAD+/NADH chart labelled SCD1Tg have muscle specific overexpression of SCD1 and therefore have fat that is high in MUFA that fails to generate a large ROS response. These mice have less than half the NAD+ levels of control mice, whether or not they are fed unsaturated fat. SCD1 overexpression is sufficient to cause reductive stress.
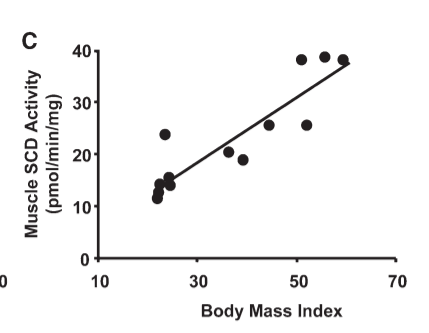
I previously wrote that muscle fibers of lean adults have a higher metabolic rate than muscle fibers of obese adults. Overexpressing SCD1 in the muscle fibers of lean people is sufficient to make them behave like muscle fibers from obese people. This is the relationship between SCD1 levels of skeletal muscle and BMI in actual, walking around human beings:
Conclusions
Metabolic rate is directly tied to the ability to regenerate NAD+. Each molecule of mitochondrial-produced ROS provides an NAD+ which gives a place for electrons to flow to and activates SIRT3, keeping our mitochondrial enzymes working.
The puritanical view of AMPK and the sirtuins – especially SIRT1 and SIRT3 – is that they are “energy sensors” that are activated by limiting caloric ingress. My previous post showed that limiting caloric intake does not necessarily increase AMPK and SIRT1 activity, in fact it can do the opposite.
I think AMPK, SIRT1 and SIRT3 are actually ROS sensors. The enzymes that control your metabolic rate are controlled by your ability to produce mitochondrial ROS.
IMPORTANT NOTE! Many of the mice used in this and other experiments on diet are C57Bl/6J mice, which means they lack a functional NNT enzyme. My reading of the papers is that the SCD1 knockout mice are on a different genetic background and DO have a functional NNT gene. My suspicion is that the mitochondrial pathway of re-using NADP+ to regenerate NAD+ is redundant. For instance, mitochondrial NADPH phosphatase activity has been described. 15 There is also a mammalian cytosolic NADPH phosphatase16 and a mitochondrial NAD+ transporter.17
It seems that in normal animals, NNT is the main way it is done. As I’ve pointed out, the C57Bl/6J mice who lack NNT have a slower metabolic rate. My suspicion is that they can still regenerate some NAD+ from NADP+. This is why the “wild type” C57Bl/6J mice on a low fat “chow” diet still have a higher NAD+/NADH ratio than those on a quite unsaturated fat diet and why decreasing fat saturation levels depresses NAD+ levels even more.
- 1.Zamora-Mendoza R, Rosas-Vargas H, Ramos-Cervantes MT, et al. Dysregulation of mitochondrial function and biogenesis modulators in adipose tissue of obese children. Int J Obes. Published online November 21, 2017:618-624. doi:10.1038/ijo.2017.274
- 2.Böttcher H, Fürst P. Decreased white fat cell thermogenesis in obese individuals. Int J Obes. Published online June 1997:439-444. doi:10.1038/sj.ijo.0800425
- 3.Hulver MW, Berggren JR, Carper MJ, et al. Elevated stearoyl-CoA desaturase-1 expression in skeletal muscle contributes to abnormal fatty acid partitioning in obese humans. Cell Metabolism. Published online October 2005:251-261. doi:10.1016/j.cmet.2005.09.002
- 4.Dziewulska A, Dobosz AM, Dobrzyn A, et al. SCD1 regulates the AMPK/SIRT1 pathway and histone acetylation through changes in adenine nucleotide metabolism in skeletal muscle. J Cell Physiol. Published online June 26, 2019:1129-1140. doi:10.1002/jcp.29026
- 5.Hinchy EC, Gruszczyk AV, Willows R, et al. Mitochondria-derived ROS activate AMP-activated protein kinase (AMPK) indirectly. Journal of Biological Chemistry. Published online November 2018:17208-17217. doi:10.1074/jbc.ra118.002579
- 6.Smith CD, Schmidt CA, Lin C-T, Fisher-Wellman KH, Neufer PD. Flux through mitochondrial redox circuits linked to nicotinamide nucleotide transhydrogenase generates counterbalance changes in energy expenditure. Journal of Biological Chemistry. Published online November 2020:16207-16216. doi:10.1074/jbc.ra120.013899
- 7.Kaludercic N, Di Lisa F. The energetic cost of NNT-dependent ROS removal. Journal of Biological Chemistry. Published online November 2020:16217-16218. doi:10.1074/jbc.h120.016368
- 8.Fisher-Wellman KH, Lin C-T, Ryan TE, et al. Pyruvate dehydrogenase complex and nicotinamide nucleotide transhydrogenase constitute an energy-consuming redox circuit. Biochemical Journal. Published online April 2, 2015:271-280. doi:10.1042/bj20141447
- 9.Son MJ, Ryu J-S, Kim JY, et al. Upregulation of mitochondrial NAD+ levels impairs the clonogenicity of SSEA1+ glioblastoma tumor-initiating cells. Exp Mol Med. Published online June 2017:e344-e344. doi:10.1038/emm.2017.74
- 10.Glier MB, Pissios P, Babich SL, et al. The metabolic phenotype of SCD1-deficient mice is independent of melanin-concentrating hormone. Peptides. Published online January 2010:123-129. doi:10.1016/j.peptides.2009.10.018
- 11.Binczek E, Jenke B, Holz B, Günter RH, Thevis M, Stoffel W. Obesity resistance of the stearoyl-CoA desaturase-deficient (scd1 -/-) mouse results from disruption of the epidermal lipid barrier and adaptive thermoregulation. Biological Chemistry. Published online April 1, 2007:405-418. doi:10.1515/bc.2007.046
- 12.Mono- and Polyunsaturated Fatty Acids Counter Palmitate-Induced Mitochondrial Dysfunction in Rat Skeletal Muscle Cells. Cell Physiol Biochem. Published online October 1, 2020:975-993. doi:10.33594/000000282
- 13.HEGSTED DM, JACK CW, STARE FJ. The Composition of Human Adipose Tissue from Several Parts of the World. The American Journal of Clinical Nutrition. Published online January 1, 1962:11-18. doi:10.1093/ajcn/10.1.11
- 14.London SJ, Sacks FM, Caesar J, Stampfer MJ, Siguel E, Willett WC. Fatty acid composition of subcutaneous adipose tissue and diet in postmenopausal US women. The American Journal of Clinical Nutrition. Published online August 1, 1991:340-345. doi:10.1093/ajcn/54.2.340
- 15.Richter C. NADP+ phosphatase: A novel mitochondrial enzyme. Biochemical and Biophysical Research Communications. Published online July 1987:253-257. doi:10.1016/0006-291x(87)90718-2
- 16.Ding C-KC, Rose J, Sun T, et al. MESH1 is a cytosolic NADPH phosphatase that regulates ferroptosis. Nat Metab. Published online March 2020:270-277. doi:10.1038/s42255-020-0181-1
- 17.Luongo TS, Eller JM, Lu M-J, et al. SLC25A51 is a mammalian mitochondrial NAD+ transporter. Nature. Published online September 9, 2020:174-179. doi:10.1038/s41586-020-2741-7
Hi Brad,
Do you know anything regarding a role of statins in obesity given that these drugs my decrease CoQ content, which serves as a bottleneck for electron transport and thus may increase ROS generation?
I didn’t know that but it is interesting. Over the next year I’m hoping to dig further into the cholesterol/bile acid/vitamin D realm.
Does taking CoQ10 as a supplement help create the bottleneck and help with ROS levels?
Actually, I would suspect is does the opposite. CoQ IS the bottleneck, so taking it as a supplement likely widens the bottleneck so that you generate less ROS. An upcoming article I’m working on will look at how it’s possible to have reductive and oxidative stress in the same cell at the same time. CoQ10 presumably relieves oxidative stress but not reductive.
Q- Do you have any suspicion that “antioxidant” AMPK agonists, e.g. the various teas hibiscus/pu’erh/etc. might act on this pathway somehow?
I think they definitely ARE. The precise mechanism is typically not known.
Thinking about this more, spitballing really, I wonder if the antioxidants are merely standing in for a relative – or transient – lack of glutathione.
Maximizing the NADPH recharge thermogenic cycle would be contingent on the size of the pool of antioxidants recharging it. I wonder if the NADPH/NADP+ cycle recharges hibiscus polyphenols, EGCG, etc too? In that respect antioxidants would help maximize one’s thermogenic response to genuine ROS producing agents like stearic acid & starch..
On the flipside, what happens in the cell if high ROS happens but the pool of glutathione is too small? Damage/true oxidative “stress”?
No edit feature so proofreading after the fact-
“would be contingent on the size of the pool of antioxidants recharging it.” .. let’s rephrase that as:
would be contingent on the size of the pool of antioxidants being recharged (consumed producing NADP+ in the process) by NADPH.
My suspicion is that it’s less about the pool size and more about the rate at which NAD+ can be regenerated. Increasing the pool size might give momentary benefit, but long term you need the enzyme systems to work.
So basically eskimos ate > 80% saturated fat because they would freeze to death if they didn’t.
Do you have any insight on if nanoplastics act on this pathway somehow? Obesity rates basically exactly correlate with tons of plastic produced; is it just a spurious correlation? Either that or the ROS theory would explain why chimps and marmosets in zoos are getting fatter as well i suppose.
But maybe its because the marmosets are driving to work and have more sedentary lifestyle than their grandparents.
I posted this a few minutes ago but I’ll repost:
Yes, enviromental toxins certainly also play a role and are probably signalling via the nuclear receptor superfamily, including AhR, SXR, etc. I haven’t talked about it on the blog yet, cause I didn’t want to go TOO far down the nuclear receptor rabbit hole, but the SXR behaves similarly to the AhR and is triggered by plastics.
http://citeseerx.ist.psu.edu/viewdoc/download?doi=10.1.1.623.7582&rep=rep1&type=pdf
If indeed they are ROS sensors, and you make a pretty damn good case that they are, that could tell us why we’ve been working off the wrong paradigm. That paradigm was trying to find facts to fit the wrong causal inputs, looking for a lever that wasn’t there.
Is this heading towards NR or NMN supplementation alongside resveratrol? Fascinating if it is!
reading that article with brain fog didn’t do me any good lol
what do NR and NMN stand for?
i was hoping for a supplement suggestion by the end, alas 🙂
Nicotinamide Riboside and Nicotinamide Mononucleotide – big in the anti-aging are.
Consider it a tad controversial, but I would be cautious with niacin supps-
https://www.ncbi.nlm.nih.gov/pmc/articles/PMC3962609/
Not satisfied with the level if detail we know about this pathway, but it’s something to take notice IMO.
I’ve thought about that… The problem is that those only increase the pool size. I think what really needs to happen is to increase turnover rate.
Niacin, NR etc promote mitochondrial fission and quality control. The mitos with damaged mtDNA are marked for removal. I don’t have a quick reference for this.
Stearic Acid stops the fission process and promotes mito fusion. Here is a study where they fed banana milkshakes to people and then checked their mitochondria.
https://www.nature.com/articles/s41467-018-05614-6
Tantalizing thought- Does over-consuming high saturated fat/ROS-producing foods create a “net calorie deficit” via ROS-induced thermogenesis? E.g. +200 kcals stearic acid result in -300 kcal net energy production? Wonder if this has ever been studied.
At the very least we know that +200 kcal stearic acid does not produce the same amount of net ATP as +200 kcal of oleic, or linoleic acid. Because of the thermogenic detoxification of the ROS that you’ve discussed here.
I’d like to get quantification of this. It’ll take some thought.
Yeah I had a reply in mind “someone smarter than me could probably calculate this” lol
There are 2 metrics the way I see it, one “easier” than the other-
1. Net energy supply considering FADH2, NADH per gram of fatty acid & associated protons pumped across the membrane, minus sinks such as UCP and NNT and finally accounting for ATP production. Confounder might be the inner membrane voltage and how that affects the ROS production. Probably variable too depending on other situations/genetics/etc.
2. Opportunity cost energy burn rate based on AMPK production from elevated NAD+ of various fatty acids due to ROS. This one is a doozy & probably not going to happen outside of an academic experiment.
Hi Brad,
What does this all mean for us laymen? Eat more steraric acid and butter? How much?
Thx
FerrisWheel
Sorry, I know it’s a bit technical. I’m hoping to step back out of the weeds next year. Anyway, for more practical advice, check out Part 2.
Hi, would you say the mechanism by which ROS activate AMPK is dependent on burning of glucose?
If yes, how relevant is it in regards to carb consumption?
I mean, does one need to eat carbs or is there always enough glucose being burned even on keto diet?
Hello,
Sorry for asking this on an unrelated blog post, but I could not find information on this anywhere. Since cacao butter is from a vegetable source (technically a bean) does it contain plant defense chemicals that could be problematic for some people or is there a certain threshold where it could become problematic ? I am planning to ditch the EVOO and go full on stearic acid mode, already stocked on gf ghee, but cacao butter would be nice for some variety.
I am less concerned about plant toxins than many others in this space. Cocoa butter seems well tolerated by most.
I very much look forward to visiting the Fire In a Bottle Hall of Fame.
I assume that the busts of Ntambi et al will be cast in stearic acid?
They ALL will be!
https://pubmed.ncbi.nlm.nih.gov/31218894/#&gid=article-figures&pid=fig-2-uid-1
https://pubmed.ncbi.nlm.nih.gov/31218894/
Play with this at your risk
Context is so important
If your are experiencing persistent or very high oxidative stress then their is a conserved reductive stress response mechanism. Overshooting that response also has deleterious consequence. Messes with your proteosome and depletes stem cells.
Hi Brad, thanks for your content.
I wanted to ask if you have info about the influence of higher protein on NAD+. All I find in humans are associations (lower NAD+/NADH-ratio with higher protein). Would be an interesting topic (especially as many people push a very high protein intake for weightloss, which does not seem to work for a good amount of people).
I’ve dipped my toe a bit into branched chain amino acids. It’s a future topic but very interesting – it seems that BCAAs are often the starting points of lipogenesis and that this is all tied in with ROS pathways….
Hey Brad, I made a video intended to summarize you torpor theory of obesity at an approachable level. It’s called “fireinabottle in a bottle” on youtube if you are interested.
Awesome, Jonathan! The link is here!
Hey Brad! Big fan of your blog and loyal customer at your shop!
After reading the latest series I’m re-reading the entire blog from the beginning. Currently I’m reading the post: “The Loss of SCD1 Prevents Obesity in Mice” (September 2, 2019),
and am curious what you think about SCD1 being upregulated in response to dietary saturated fat. Wouldn’t this eventually lead to a large enough percentage of the stored body fat being UNsaturated? And wouldn’t this create the torpid metabolic state? Just wondering if/how you’ve squared this with the overall theory? Thanks much!
So this requires some subtlety. Starch and saturated fat both upregulate SCD1 a LITTLE (maybe 50%). This is appropriate. Our body fat, it seems, does not like to be as saturated as beef suet, for instance. When things are moving towards obesity – a mice lacking SIRT3 on a high fat diet – you see an increase in SCD1 of something like 500%. When SCD1 goes to THOSE levels is when obesity in ensured.
Random article I stumbled across reading about thyroid- https://www.ncbi.nlm.nih.gov/pmc/articles/PMC3872098/
Choice quote:
“The relation between respiratory rate (measured as the volume of O2 consumed per min) and ROS production is not a direct one, for low respiratory activity is often associated with high ROS generation, whereas the raise in the activity of the respiratory chain can result in a decrease in the rate of ROS production. This paradoxical relation derives from the fact that the electron transfer in mitochondria can proceed at different paces according to the availability not only of oxygen but also of energetic substrates and ADP”
IIRC- inter-mitochondrial ROS with Glutathione et al, is consuming NADH but without corresponding use of O2 as complex IV isn’t involved with this NNT thermogenic process? This would neatly explain the “paradox” of ROS generation vs. O2 consumption – but what they’re not saying here is how ROS generation under low O2 consumption is also consuming fuel & generating heat out of it, right?
Although- reading about the Citric acid cycle a bit more- I might be mistaken, as some NAD+ -> NADH steps do expel CO2, which likely got its O2 from somewhere, just not sure if it came from respiratory oxygen.