
I’ve argued in The SCD1 Theory of Obesity Part One and Part Two, as well as in This Is Your Body Temperature On Vegetable Oil that if your body fat is highly saturated, you will respond to an increase in body fat by increasing your metabolic rate through a process known as adaptive thermogenesis.
In this post we’re going to look at the effect of some different diets on the saturation levels of stored body fat.
Definitions
The jargon is starting to build so I thought a little dictionary seemed appropriate.
- Adaptive Thermogenesis: When your body burns off calories as heat rather than storing them as chemical energy (ATP). Adaptive thermogenesis is caused by uncoupling you mitochondria through the production of uncoupling proteins. Adaptive Thermogenesis is done in response to Reactive Oxygen Species (ROS) generation in the mitochondria. It increases your metabolic rate.
- Reactive Oxygen Species(ROS): signalling molecules produced in the mitochondria especially when saturated fat is being burned. The lower “octane” of the fuel (the more unsaturated it is), the less ROS is produced.
- SCD1: A protein that turns saturated fat into monounsaturated fat. SCD1 prevents adaptive thermogenesis and is associated with obesity.
- Desaturase Index: an indicator of SCD1 activity. A higher score means SCD1 is more active. It’s derived by dividing oleic acid level by stearic acid level.
- UCP1: An uncoupling protein produced in fat tissue. Uncoupling proteins are the mechanism by which mitochondria uncouple.
- Leptin: A hormone produced by fat cells. The more fat you have, the more leptin. Leptin plays the dual role of increasing the amount of fat sent into mitochondrial furnace by activating CPT-1 and shutting off SCD1, both of which should increase ROS production.
- CPT-1: the guy at the end of the velvet rope controlling the rate of fat entry into the mitochondrial “club”. The more active CPT-1 is, the hotter the metabolic flame and the more ROS is produced.
- Saturated Fat: A fat where every Carbon in the chain is bonded to two other Carbons and two Hydrogens. The Carbon is “saturated” with Hydrogen. Saturated fats include palmitic acid and stearic acid.
- Monounsaturated fat (MUFA): A fat where two Carbons in the chain are double bonded to each other. Those two Carbons are only bonded to one Hydrogen each, could hold another Hydrogen each and are therefore not “saturated” with Hydrogen. The most common MUFA is oleic acid, which makes up 70% of olive oil. Did you know that ground beef has more MUFA than it does saturated fat?
- Polyunsaturated fat (PUFA): In a polyunsaturated fat , multiple pairs of Carbons have a double bond to each other rather than being “saturated” with Hydrogens. Linoleic acid is the most prominent PUFA, being the dominant fat in corn and soybean oils.
Adaptive Thermogenesis
Fat cells release a hormone called leptin, whose job (among others) is to increase the activity of an enzyme called CPT-1. CPT-1 is the gatekeeper of the mitochondria, controlling how fast fat can be shuttled in. The faster fat is shuttled into the mitochondria and the more saturated it is, the more Reactive Oxygen Species (ROS) are produced at the mitochondrial bottleneck. When maximal ROS are produced in the mitochondria, SCD1 is down-regulated, which keeps your fat saturated and UCP-1 (uncoupling protein) is produced. UCP-1 “uncouples” your mitochondria – allowing protons to fall through the mitochondrial electron gradient, which burns off calories as heat rather than storing them as chemical energy. This causes your body temperature to rise and prevents obesity.
Adaptive thermogenesis is the biologically appropriate response to weight gain.
When your body fat becomes too unsaturated, you lose the ability to drive ROS production at the mitochondrial bottleneck. You lose the ability to do adaptive thermogenesis, your metabolic rate and body temperature drop, and the end-result is obesity. This is the theory.
I believe the highly saturated bodyfat of starch eating people explains this statement from the authors of the original China Health Study, “In the China Study, the least active Chinese consumed 30% more calories than their American counterparts yet their body weight was 20% lower. The excess calories were lost as heat rather than being stored as fat.”
Stored Body Fat Saturation Level Is Controlled By Diet
In This Is Your Body Temperature On Vegetable Oil, I argued that the reason that starch eating cultures remain thin is that their body fat is highly saturated. I used the saturation level of the red blood cell membranes of Chinese workers as a proxy indicator of the saturation level of their body fat.
Red Blood cells are easy to obtain and so there is a lot of comparative data on them. Still, we don’t metabolize red blood cell membranes, we metabolize the fats stored in adipose tissue. I’m presenting a 1962 paper1 that compares the body fat of Americans as the vegetable oil epidemic was just getting started with that from starch eating cultures in Nigeria and Columbia and two more modern papers looking at American body fat.2,3
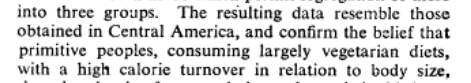
We’ll take a look at the diets and fat levels of two mostly-starch-eating tribes in Nigeria in 1962; Columbians in 1962 eating starch, sugar and some animal foods; Americans in 1962 eating starch, sugar, much more animal foods and some vegetable oil; and then Amercians in the 1990s eating much more vegetable oil.4 I omitted the third Nigerian tribe (Group C) because it didn’t add much to the discussion, The Japanese since the log chain fish oils in their diet were a confounder and the Jamaicans because the short chain saturated coconut oils in their diet were a confounder.
The groups in Nigeria resemble the Chinese. Lots of starch, little dietary fat, high caloric burn.5
| Nigeria ’62 | Nigeria ’62 | Columbia ’62 | US ’62 | US ’91 | US ’98 | |
| Dietary Factors | ||||||
| Oily Grains | +++ | – | 115g | 20g | 37g | 38g |
| Low Oil Grains | – | – | 100g | 217g | 264g | 277g |
| Tubers | – | +++ | 225g | 146g | 167g | 178g |
| Sugar | – | – | 160g | 142g | 175g | 194g |
| Animal Foods | + | + | 353 cal | 1010 cal | 978 cal | 1003 cal |
| Palm Oil | – | + | 0.3g | 0.2g | 0.2g | 0 |
| Soybean Oil | – | – | 0.5g | 18.7 g | 52g | 56g |
| Corn Oil | – | – | 0.7g | 2.2g | 5.5g | 2.3g |
| Cottonseed Oil | – | – | 3g | 8.6g | 3.4g | 1.9g |
| Coconut Oil | – | – | 3g | 1.7g | 0.8g | 0.3g |
| Linoleic Acid Content | 5.5% of cals | 2-3% | 2-3% | 6-8% | 10-12% | 10-12% |
| Stored Body Fat Composition | ||||||
| Palimitic Acid (16:0) | 26.2 | 28.5 | 25.1 | 24.6 | 19 | 15.3 |
| Stearic Acid (18:0) | 9.6 | 5.9 | 6.9 | 6.7 | 2.9 | ND |
| Saturated Fat | 40.4 | 39.5 | 39.1 | 35.7 | 24.4 | 21.6 |
| Oleic Acid (18:1) | 42.3 | 46.2 | 45.7 | 50.3 | 41.5 | 40.5 |
| MUFA | 50.1 | 52.3 | 54.8 | 56.6 | 54.5 | 56 |
| Linoleic Acid (18:2) | 8.7 | 7.9 | 5.5 | 7.9 | 17.2 | 18.5 |
| PUFA | 9.2 | 8.0 | 5.5 | 8.1 | 21.1 | 21.7 |
| Desaturase Index | 4.4 | 7.8 | 6.6 | 7.5 | 18.8 | |
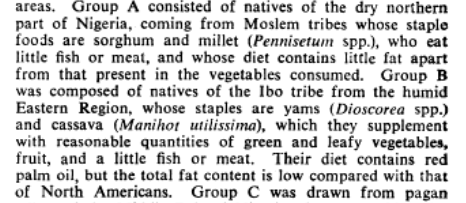
The first column is a Nigerian tribe (Group A) whose staple foods were millet and sorghum, both of which are relatively “oily” grains – similar to corn – providing between 4 and 6% of calories as linoleic acid.6 This group has the most saturated fat, clocking in at 40.4%. They also have by far the most stearic acid, low oleic acid (MUFA) and the lowest desaturase index. PUFA is a known suppressor of SCD1 activity and the combination of a starch based diet with a relatively high level of PUFA leads to very low SCD1 activity.
The second column is the Nigerian tribe (Group B) living off most tubers – yams and cassava – with a bit of palm oil. Tubers supply well under 1% of calories as linoleic acid. Palm oil is 10% linoleic6, so if 20% of their calories were from palm oil, the diet would be around 2% linoleic acid. They still have very high levels of saturated fat but stearic acid levels are lower and oleic acid levels are higher. This is exactly as expected. This is biologically appropriate regulation of SCD1. When dietary PUFA drops, SCD1 is increased and more stearic acid is converted to oleic acid to maintain an appropriate fuel octane level. So oleic acid and linoleic acid are moving in opposite directions. It’s an inverse relationship. One goes up when the other goes down.
The third column is a population from Columbia, who ate a diet very low in linoleic acid in 1962 – most of it was from corn (in tortillas, etc) and a few grams per day of cottonseed and corn oil. Their diet differs from the second group in Nigeria largely by having more animal foods and because it is very high in sugar, a known upregulator of SCD1. The extra sugar doesn’t seem to be a problem in this context, however. Overall, their fat composition is very similar to the second group from Nigeria, with the lowest amount of stored linoleic acid and a similar amount of stearic acid, saturated fat and oleic acid. Animal products are significant sources of oleic acid monounsaturated fat, palmitoleic acid and conjugated linoleic acid, so it’s possible that the animal fats were counteracting the effects of the sugar.
The fourth column is from Americans in 1962. The American diet differed from the others in being much higher in animal based foods – a very significant source of oleic acid MUFA and a source of PUFA – and contained around 30g per day of highly unsaturated vegetable oil – soybean, cottonseed and corn oil. It was similarly high in sugar to the Columbian diet.
If anything, we’d expect the American desaturase index to be lower than that seen in Columbia due to the increased PUFA content of the diet. On the other hand, perhaps the large increase in oleic acid from animal foods could contribute to total oleic acid levels. At any rate, what we see in American fat from 1962 is lower saturated fat levels overall, very high oleic acid levels and a relatively high desaturase index.
Dietary Linoleic Acid Content Over ~6% Breaks The System
That brings us to 1991. There’s nothing equivocal about this result! Soybean oil consumption has exploded along with stored linoleic acid levels, saturated fat levels have cratered but stearic acids levels have cratered even more dramatically! The desaturase index is through the roof despite no real increase in oleic acid consumption. So increasing consumption of PUFA led to a major increase in SCD1 activity, which is the opposite of what is supposed to happen. PUFA and SCD1 activity increased in parallel instead of keeping an inverse relationship. This is a broken regulatory system.
By 1998, the situation only got worse, with saturated fat levels continuing to plummet and PUFA levels continuing to increase, although that paper didn’t report stearic acid levels.
Why Did This Happen?
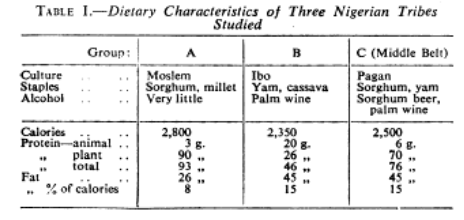
In the SCD1 Theory I pointed out that a LITTLE bit of mitochondrial ROS increases the production of SCD1 and a LOT of ROS suppresses it.7 This is biologically appropriate. Remember that ROS is a signalling molecule that tells the nucleus what the mitochondria is doing. A little bit of ROS is produced during glucose metabolism, when it is biologically appropriate to increase SCD1 as we saw in the tuber eating group of Nigerians compared to the Nigerians with relatively higher PUFA consumption – the body is trying to achieve the proper octane and fat derived from starch without SCD1 would be almost entirely saturated.
When the mitochondria is burning fat SCD1 should be shut down, since the fat should be burned at the octane level it was stored at. But if the PUFA level of the fat rises too much, the fuel octane gets too low, only a little ROS is generated, the nucleus continues to think the mitochondria is burning glucose and SCD1 continues to be produced while fat is being burned. At this point metabolic regulation is broken, PUFA and MUFA are both high, saturated fat is low and the person can no longer due adaptive thermogenesis. Metabolic rate slows, body temperature drops and obesity is the end result.
- 1.HEGSTED DM, JACK CW, STARE FJ. The Composition of Human Adipose Tissue from Several Parts of the World. The American Journal of Clinical Nutrition. Published online January 1, 1962:11-18. doi:10.1093/ajcn/10.1.11
- 2.London SJ, Sacks FM, Caesar J, Stampfer MJ, Siguel E, Willett WC. Fatty acid composition of subcutaneous adipose tissue and diet in postmenopausal US women. The American Journal of Clinical Nutrition. Published online August 1, 1991:340-345. doi:10.1093/ajcn/54.2.340
- 3.Garland M, Sacks FM, Colditz GA, et al. The relation between dietary intake and adipose tissue composition of selected fatty acids in US women. The American Journal of Clinical Nutrition. Published online January 1, 1998:25-30. doi:10.1093/ajcn/67.1.25
- 4.FAOSTAT Food Disappearance. FAOSTAT. http://www.fao.org/faostat/en/#data/CC
- 5.Mann GV, Nicol BM, Stare FJ. Beta-Lipoprotein and Cholesterol Concentrations in Sera of Nigerians. BMJ. Published online October 22, 1955:1008-1010. doi:10.1136/bmj.2.4946.1008
- 6.USDA FoodData Central. USDA FoodData Central. https://fdc.nal.usda.gov/
- 7.Matsui H, Yokoyama T, Sekiguchi K, et al. Stearoyl-CoA Desaturase-1 (SCD1) Augments Saturated Fatty Acid-Induced Lipid Accumulation and Inhibits Apoptosis in Cardiac Myocytes. Stadler K, ed. PLoS ONE. Published online March 8, 2012:e33283. doi:10.1371/journal.pone.0033283
Brilliant again.
A thought and a question:
If we were to modify desaturase index by adding body fat LA to the numerator, might the resulting index,
call it DI’, track ROS better?
Also, what sort of FAs were being used to get 500x the peroxide? Are these in testtubo results?
I’m not quite sure I understand your question about altering the DI? Every tissue will have a different DI – red blood cell membrane phospholipids are different than whole membrane are different than subcue fat is different than omental fat, so you can really only compare between the same tissue.
Hi!
You kind of laid framework into understanding, why people do well with hi-fat diets (inuits, masai) or hi-glucose diets (tropics, Asia). Also, why their energy reserves are composed the way they are.
This could also explain the little “metabolic advanage” found in low carb diets -as long as there is not too much LA in fats.
Still wondering the mixed diet, “energy poisoning” when there is a lot of everything, combining fat and glucose the way nature never did.
Also, excess alcohol and MEOS with excess ROS creation may fit in the story. Heavy drinkers are quite lean … (depends on alcohol I guess).
No-one eats same calories each day, so the control mechanism has to be there in order to remain weight stable. Extra heat to loose extra calories, and extra mass is lost while exhaling CO2 and H2O (calories burned)…
Interesting.
Cool also that you can refer to Mr’s like HEGSTED DM, STARE FJ, Willett WC. Fat haters hall of fame!
JR
Ha!
Yes on the hall of fame. It’s fun to use their research against them.
Still, they knew in 1962 – they did the research themselves – that starch eaters had high saturated fat levels – and therefore their blood would have been awash in “artery clogging saturated fat” – and they knew that the Nigerians, at least, had minimal to no issues with heart disease.
Brad
I think the math is wrong on the Desaturase Index US 91? 41.5/2.9 = 14.3
Does this mean that your index of 2.1 isn’t on the “wrong side” after all?
Good call on the math. It’s can be really hard to divide one number by another in the era of ubiquitous cell phone calculators…
I should have made this more clear in the article. There is a huge difference between adipose fat composition and membrane phospholipid composition, so you can’t really compare DI across tissues.
“The first column is a Nigerian tribe (Group A) whose staple foods were millet and sorghum, both of which are relatively “oily” grains – similar to corn – providing between 4 and 6% of calories as linoleic acid.6
This group has the most saturated fat, clocking in at 40.4%. They also have by far the most stearic acid, low oleic acid (MUFA) and the lowest desaturase index. PUFA is a known suppressor of SCD1 activity and the combination of a starch based diet with a relatively high level of PUFA leads to very low SCD1 activity.”
I’m confused. I thought PUFA creates less ROS, thus up-regulates SCD1. Why is PUFA a suppressor of SCD1?
This is a common source of confusion. The key is in the dose. A LITTLE PUFA suppresses SCD1. A LOT (more than 6% of calories, Americans average 10-12%) increases it.
Are there negative effects from consuming plenty of pufa rich seafood such as fresh roe, monkfish liver, etc?
I don’t think so? If you REALLY want to dig into it, this Hyperlipid Post is an interesting place to start.
Hi Brad, excellent stuff. I’ve found data of even more saturated fat populations (albeit with an extremely high saturase index, more on that in a sec!)
This study has exhaustive data of the Polynesian people from Pukapuka and Tokelau. They both eat a lot of coconut, really, a LOT. The Tokelau get nearly 50% of energy from coconut. THe rest comes from tubers and minor amounts of fish. The Pukapuka eat less coconut (around 35%) and more starch. The diets are (were…) low in sucrose as well.
Total saturated tokelau: 51.6%. Stearic is only 2.8% however, oleic is 27.8. LA is only 3.8%. So in the context of a high fat diet there is very little de novo lipogenesis it seems. No Stearic in either population. It’s really low in coconut so it’s not surprising.
On a note: the researchers do mention that the Pukapuka are leaner than the Tokelau.
https://www.researchgate.net/publication/15927580_Cholesterol_coconuts_and_diet_on_Polynesian_atolls_A_natural_experiment_The_Pukapuka_and_Tokelau_Island_studies
(the table from the research with intake and biopsy data) https://gyazo.com/3522eec725e6d3ba43da9e6a83521ea5
Interesting papers, thanks!
Yes, they are low in stearic, but this is, as you’ve pointed out, due to the high amounts of shorter chain saturated fats due to the diet. I’m not sure that in this case we can assume that the desaturase index will be a good indicator of SCD1 status. The high lauric acid, etc, is a real confounder. I’ll take a harder look at this later.
Brad
Not to be cheeky, because I love your research and buy in totally, but saturated fat is low octane (it burns better), PUFA is high octane in the analogy. A higher octane number inhibits gasoline from burning in high compression engines, lower octane gasoline atomizes easier and burns faster at lower pressure.
Haha!
Ok, I guess I never thought that much about how gasoline octanes work. Good to know!
Brad
Hi Brad,
Been reading through the entire blog and blowing my mind more and more each post. I have a simple question but just wanted to double check my math.
So when you say PUFA should be <6% of calories, the equation is ((Grams of ingested PUFA)*9)/(Total Daily Calories from all Macros) correct?
Yup, you’ve got it!
Brad