
Introduction
The most common explanation given for the recent wave of obesity is that “We don’t work as hard as we used to and we overeat.” This is what evolutionary biologist Stephen Jay Gould calls a “just-so story”, an untestable narrative explanation for a cultural practice, a biological trait, or behavior of humans or other animals. This idea comes out of the puritanical nature of American thought. If a person is obese they must be gluutonous and slothful. But if this is right, why was the New York City banker, who took the subway to work, the elevator to his office and sat at a desk all day, lean in 1960 and fat in 2020?
My belief is that the wave of modern obesity is caused by biochemical changes due to the recent addition of large amounts of polyunsaturated fat to our diet, which ultimately led to our regulatory feedback systems becoming deranged as exemplified by the increase in out desaturase index that happened sometime between 1962 and 1991.
The desaturase index (DI) is simply the amount of oleic acid (the monounsaturated fat also known as 18:1) divided by the amount of stearic acid (the saturated fat known as 18:0) in any given tissue. It varies a lot between tissues, so that a blood test measuring red blood cell phospholipids gives you a much different range of DI values than does a fat tissue biopsy, but a high DI within any given tissue is strongly associated with obesity and is a sign that a master regulatory enzyme – SCD1, whose only job is to convert saturated fats to monounsaturated fats – has become dysregulated.
Newborns
If we look at obese newborn babies, we can eliminate the idea that they got that way by sloth or gluttony. Babyfat is cute, but some have more than others.
This paper1 examined the question of whether or not the maternal desaturase index (DI) is associated with obesity in newborns. These are the conclusions of the authors:
18:1/18:0 was associated with measures of infant anthropometry at birth (maternal and fetal markers) and up to 2 years of age (maternal markers only). Dietary intakes did not show strong associations with 18:1/18:0. … maternal SCD-1 activity measured via 18:1/18:0 was involved in the fetal programming of infant obesity, but could not be substantially modulated by shortterm diet in pregnancy.
Marchirio Et Al.
So the maternal post-obese phenotype can seemingly be transferred straight to the next generation. Isn’t that lovely?
This paper relies on some pretty heavy statistical methods. I’m not a statistician so I’m relying on the study authors to have gotten this right. If any statisticians read this I’d love to see your comments on this.
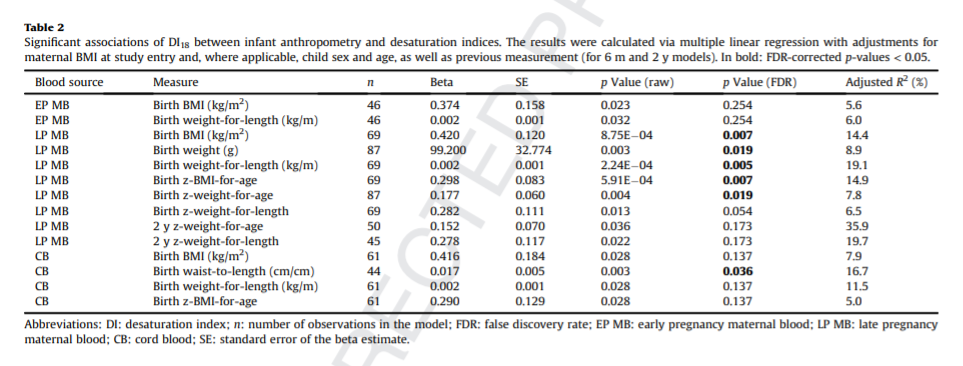
My understanding is that the numbers in bold are the ones that were statistically significant after adjusting for the “False Discovery Rate(FDR)”, which corrected for things such as maternal BMI, maternal blood sugar and maternal insulin levels. Even after the corrections for these confounding variables, there is a strong correlation between late pregnancy maternal blood DI and newborn BMI, birth weight and weight-for-length. The DI of blood from the umbilical cord was strongly correlated to the birth waist-to-length. The correlations remained significant at two years of age, suggesting that the maternal DI helped set the newborns up for a lifelong battle of the bulge.
But sloth and gluttony didn’t play a role in it.
- 1.Marchioro L, Hellmuth C, Uhl O, et al. Associations of maternal and fetal SCD-1 markers with infant anthropometry and maternal diet: Findings from the ROLO study. Clinical Nutrition. Published online July 2020:2129-2136. doi:10.1016/j.clnu.2019.08.030
A statistician here.
P-values and “statistical significance” are dead ends of statistical inference. It was soon realised after their introduction that they are very problematic concepts, and invite misinterpretation. However, the damage was already done, and their use spread widely among the applied fields. For the last decades statisticians have fought to remove these concepts from applied fields with some mild success. Some scientific journals have finally started to ban their use in their articles.
What is a P-value? Many people like to think that it is the probability that the null hypothesis is true given the observed data. The null hypothesis is a conservative statement, like “no effect” , “no correlation”. Within that misinterpretation a “small” P-value would mean that “no effect” has small probability of being true, and thus the “having an effect” must have a “high” probability. But that is not what a P-value is.
Other people like to think that that it is the probability of observing the data we have observed under the assumption that the null hypothesis was true. If the data was “unlikely” under the null hypothesis, surely then the null hypothesis would not be true? But that is not what a P-value is.
The P-value is the probability that we would obtain new data that is even more extreme than the one we have actually observed, under the assumption that the null hypothesis is true. It compares the result we have to other results we could have potentially had, if the null was true. If there is a small probability for more extreme result, then the result we have actually observed is thought to cast a doubt on the null hypothesis. How small the probability of more extreme result should be, before we would doubt the null? There is absolutely no basis for any single value to be universally used. However, this is exactly what we have: 0.05 is the most commonly used threshold. Some use 0.01, some 0.001, but these are equally arbitrary choices. If P-values are used for inference about the null hypothesis, at the very least the “level of significance” should be calibrated for each application by taking into account the potential (health!) consequences of “accepting” or “rejecting” the null.
What we really would like to know is how credible are alternative hypotheses given what we already know and given the new data that we have just collected. That is the goal of science. Instead, we assume a hypothesis to be true, and then calculate probabilities about data we can’t have. I have only touched the surface of the problems regarding p-values and statistical significance, but will not continue much.
If P-values are useless, what CAN we use to make something useful with statistics? Look at the effect sizes and uncertainty about them! They are best estimated using so called Bayesian statistics, which is designed to do exactly what science should do: build on previous knowledge and update what is known using new observations. Bayesian statistics provides probability distributions for parameters of interest: each potential parameter value has a probability, which measures how strongly we should believe in each value. It is not about accepting or rejecting hypotheses or classifying results to “statistically significant” or “insignificant”, but to provide a continuum of credibility of hypotheses, which changes as new information becomes observed.
Now, to this particular case. Bayesian inference has not been used in this study. We can disregard the P-values, and look at the Beta -coefficients and their standard errors. Although not conceptually correct, they can be thought to roughly approximate a probability distribution that describes what is known about those coefficients. A 95% probability interval for the coefficients could be constructed as Beta +- 1.96 *SE. If you do this, you probably notice a connection: when 0 is not included within the interval, you probably have a bolded P-value showing statistical significance. In those cases we are just quite sure that the effect is positive or negative. If zero is included in the interval does not mean that there is no effect. We are just more uncertain whether the effect is positive or negative.
But the most meaningful thing would be to look at the actual coefficients, and their meaning. When there is not much uncertainty, then a clinically insignificantly small coefficient can be highly “statistically significant”. And when uncertainty is high, it often means that the coefficients can have very important effects that should be brought up for closer study, but they are typically excluded from conclusions, because of the hunt for statistically significant results.
Look at interval estimates of effect sizes, think what the extremes would mean in practice, forget P-values and statistical significance.
I know that many will disagree.
Thanks for this, very interesting! I’m not sure how it effects my thoughts about this paper!
Brad
Perhaps you could give less weight on looking at what is “significant”. It is not the same thing as a “strong correlation”. R2 would be more interesting. How large proportion of the overall variation can be explained by each factor?
For example, LP MB blood source explains only 8.9% of the variation of the birth weight. One unit of increase in DI would “imply” on average 99.2g of increase in birth weight.
The strongest association is between LP MB and 2-y z weight-for-age, where 35.9% of the variation is explained. This is not “significant” because of higher uncertainty about the beta parameter. This is the highest correlation among all, but I would not call it a strong correlation by any means.
Unfortunately, all we have is what the authors gave us, which is just a correlation score and a p-value.
Brad
Can you eat salmon on TCD?
Yes!
The very long chain PUFA in salmon are metabolized in the peroxisomes and don’t effect mitochondrial metabolism. David got great results using fish oil.
Brad
Hi Brad!
This is my first post here, but I’ve been following you almost from the beginning and want to thank you for sharing your fantastic work with us!
I want to ask you about fish oil, specifically supplements. Aren’t fish oil supplements highly prone to oxidation? I can understand eating actual fish, but fish oil itself is still a PUFA that’s heavily processed, transported, and almost never sold with any refrigeration. I can’t link to them off the top of my head, but I recall studies demonstrating most fish oil on the market is highly oxidized or rancid. I can’t just go to Costco, buy fish oil in bulk, and expect an easy net positive in SDC1 and PPAR gamma downregulation, can I?
Simon
I’m not an expert on the marketplace for fish oil. I know that it has shown some benefit in studies on mice, for instance, and I assume they are using whatever is available to the rest of us. Oxidation is certainly a concern and the reason I haven’t supplemented any fish oil myself until very recently despite having low Omega 3 levels. But the more I research the more benefit I see to fish oil from the perspective of activating PPAR alpha. I’m doing a two week trial on it right now to see if I can an uptick in metabolic rate/body temperature. So far, so good.
Also, I like seafood but I don’t particularly care for salmon, so it’d be tricky to me to really get much Omega 3 from fish. I like salmon sushi. I suppose I could eat that but it would get pretty expensive!
Brad
N/M my last reply after reading some of Ray Peat’s blog on cod liver oil I think I will be skipping on that as well.
I have the same concern with fish oil and believe most is oxidized. A great alternative would be rosita cod liver oil. Get omega 3 without any worry of oxidation.
Just So Stories are best left to Rudyard Kipling! The master story teller of Obesity is best left to Brad the Bard of Pufa!
Thanks Brad , excellent post Shannon (Shaza)
Brad, do we have consensus on what a high, or low, DI is? I saw your post where you shared yours is 2.1, a Chinese citizen was around 0.9, and a fit reader of your blog was 1.6. I am not as fit as the guy in your post but I have a DI of 1.4, as of my OQ test from January, 2020. That said, I am 51 and can only get to the gym 2x a week. And then, Covid made that difficult for most of last year….then three kids doing school from home….you know, typical story from last year.
I still feel like I could lose another 20 pounds. After years of strict keto I stalled and found your blog in late 2019. Since I found you I’ve purchased some of your products and have further eliminated any source of PUFA and most MUFA from my diet. I use your stearic acid powder mixed with butter daily. I’ve not really lost too much weight, maybe 5lbs, but perhaps I haven’t been as strict as I could be. What’s amazing to me, in light of my years of careful carb watching paranoia, is that I haven’t gained weight by adding beans, potatoes, rice, and All-Butter Walmart croissants back to my diet. I pretty much eat to satiety.
I took my latest OQ today and will hopefully have new info in the next couple weeks, just curious to get your thoughts.
Thanks!
Hi Mike!
I’ve been doing a real deep dive into the literature on historical DIs of “healthy” cultures. I have to collate it all, and I’ve generated some other tings to look for in the OQ test. Keep an eye on the blog over the next two weeks.
Brad
Thank you, I’ll keep an eye out for it!