Introuction to Torpor, Sloth an Gluttony
This is the first post in my new “Sloth and Gluttony” series where I will be arguing that the obesity epidemic was NOT caused by billions of people around the globe simultaneously becoming slothful and gluttonous. I will argue that in fact the reasons are biological and evolutionarily conserved. Specifically I will argue that increased consumption of linoleic acid (the primary Omega-6 polyunsaturated fat AKA PUFA found in dietary sources) over the last 100 years triggered a metabolic change. Hibernating animals consume linoleic acid to get into an alternate metabolic state called torpor, which is defined by high expression of “lipogenic” (fat making) genes, including PPAR gamma – the “master regulator of adipogenesis and obesity” 1– and it’s buddies fatty acid synthase (FAS – it makes fat), elongase (ELOVL6 – it lengthens fat) and most importantly desaturase (SCD1 – it unsaturates fat).
Animals in torpor have highly unsaturated fat. In addition to often (not always) having high levels of linoleic acid, they also have a high ratio of oleic acid (the dominant monounsaturated fat in olive oil) to stearic acid (a saturated fat which SCD1 converts to oleic acid). High levels of oleic acid and low levels of stearic acid is known as the Desaturase Index (DI18). A high DI18 means that an organism has a high level of desturase activity, which is another way of saying that it makes a lot of the enzyme SCD1. If you make a lot of SCD1, you have upregulated lipogenic genes. You have very unsaturated body fat.
Leptin is a hormone produced in fat cells whose job is to increase our metabolic rate to burn off calories as heat.2 The fatter one is, the more leptin one produces and the higher ones metabolic rate should be. If you are a hibernating animal, being leptin sensitive is bad. Leptin makes you burn off your stored body fat reserves before winter. The good news for them is that if they can get their body fat to be unsaturated enough, they can become leptin resistant. Leptin exerts its effects by producing reactive oxygen species (ROS) in the mitochondria while fat is being burned. If enough ROS are produced by leptin-induced fat burning, calories can be burned off as heat through a process known as thermogenesis. However, if fat becomes sufficiently UNsaturated due to high desaturase activity, the hibernating animal is spared from leptin’s fat burning ways and is able to store fat for hibernation.
Between 1962 and 1991 the amount of linoleic acid in the american diet increased dramatically due primarily to increases in vegetable oil and poultry consumption. Our desaturase activity also increased. Just like hibernating mammals, we became torpid.
| American Fat Composition | 1962 | 1991 |
| Linoleic Acid | 7.9 | 17.2 |
| Stearic Acid | 6.7 | 2.9 |
| Oleic Acid | 50.3 | 41.5 |
| DI18 | 7.5 | 14.3 |
Every branch of the mammalian family tree – egg layers, marsupials and placental mammals – has hibernators on it. This suggests that torpor evolved before mammals did. Birds also are warm blooded and many of them can hibernate. Torpor is presumably ancestral to both birds and mammals. There are primates who hibernate: lemurs. You’re a primate. (Presumably, if you a squirrel reading this a LOT of stuff has gone down in the meantime.) If creatures on the mammalian family tree all the way from the egg laying spiny anteater to the dwarf lemur all have the ability to enter torpor what are the chances that you can’t?
The thesis of this series of posts is this: Leptin increases in response to an increase in body fat. Leptin increases metabolic rate to prevent further fat storage. To avoid the fat burning effects of leptin, hibernators eat polyunsaturated fat to make them torpid. A torpid metabolism is a leptin resistant metabolism. We are all torpid.
Food In 1939
A core part of my argument is that if anything, caloric consumption amongst sedentary city dwellers has dropped since the 1930s.
The 1939 USDA Yearbook of Agriculture3, “Food and Life”, has a chapter called Present-Day Diets in the United States. It goes into great detail about what people actually ate in the late 30s. White flour. Sugar. Meat. Potatoes. Vegetables. Fruit. Butter. Milk. Eggs. Lots of all of them.
Most of the chapter is about people living in cities. I’ll focus on wealthy New Yorkers. The subway system opened in 1904. The first cabs became available in 1897. The first elevators were built in 1854. Jogging as a recreational enterprise wasn’t invented until the 1960s. All of which is to say that a 60 year old advertising executive working on Madison Avenue in 1939 would have been too old to fight in WWI, would have gotten to and from work on public transit, would have taken an elevator to his office where he sat at his desk. (I am using the he pronoun, I presume there were few female advertising execs in 1939 on Madison Avenue.) He would not have jogged in the evening. He would have been a more or less sedentary adult.
This shows caloric consumption for different regions, and black versus white, among men split up within regions by economic class. Wealthy people ate more.

The 1939 report channels the data through “him”. The “per capita” numbers presented are per adult male as defined as one “nutrition-requirement unit”. This is just what it was at the time.

Notice the attitude at the time: the more spent on food, the better the diet. There is literally zero hand-wringing in this article about “but watch your calories.” Calories weren’t a problem then. If you made more money, if you were a wealthy person working a sedentary job (bankers, ad executives, lawyers, wall street), you bought and presumably ate more food and it was all to the good. How much food? 4400 calories per day or so. At 4400 calories per day a sedentary male was expected to weigh 154 lbs.
New Yorkers (North Atlantic cities) didn’t even earn the crown of most calories. That honor went to those in Pacific cities, buying 5100 calories of food per day.
This was the great depression. People from this era (my grandparents parents) are notably frugal. I find it hard to believe that wealthy people in LA were buying 5100 calories of food per day per nutrition-requirement unit only to throw half of it out.
What were people eating?
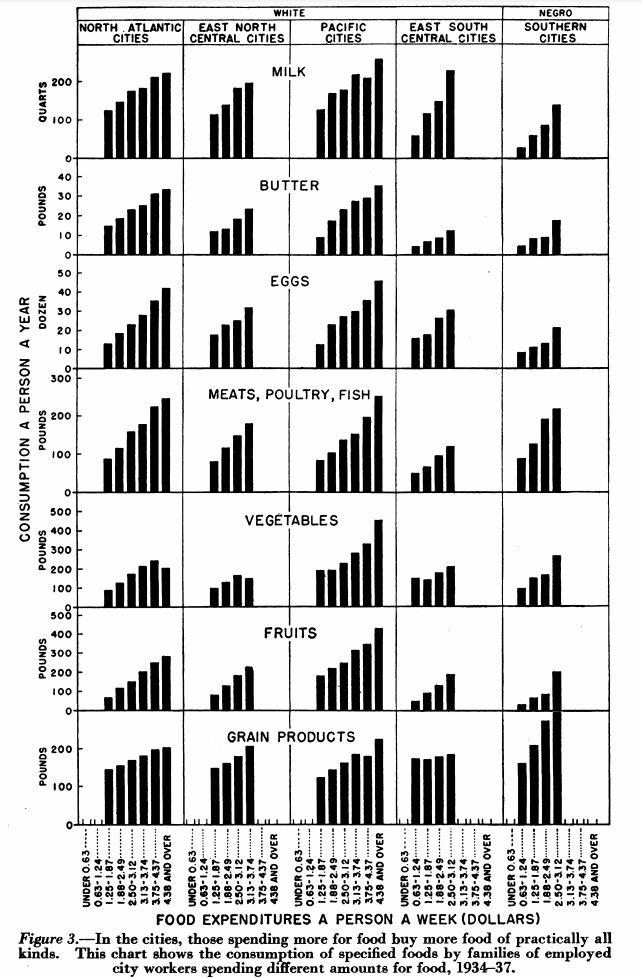
Different regions, different fats. Most of the other fats in the South, among both black and white families, was lard, bacon and salt pork:

A different kind of pie chart.
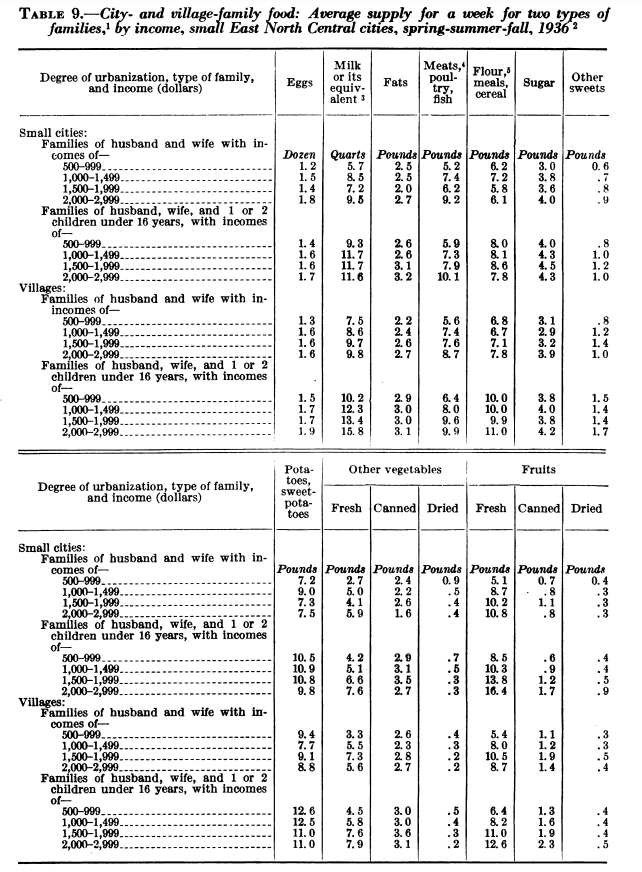
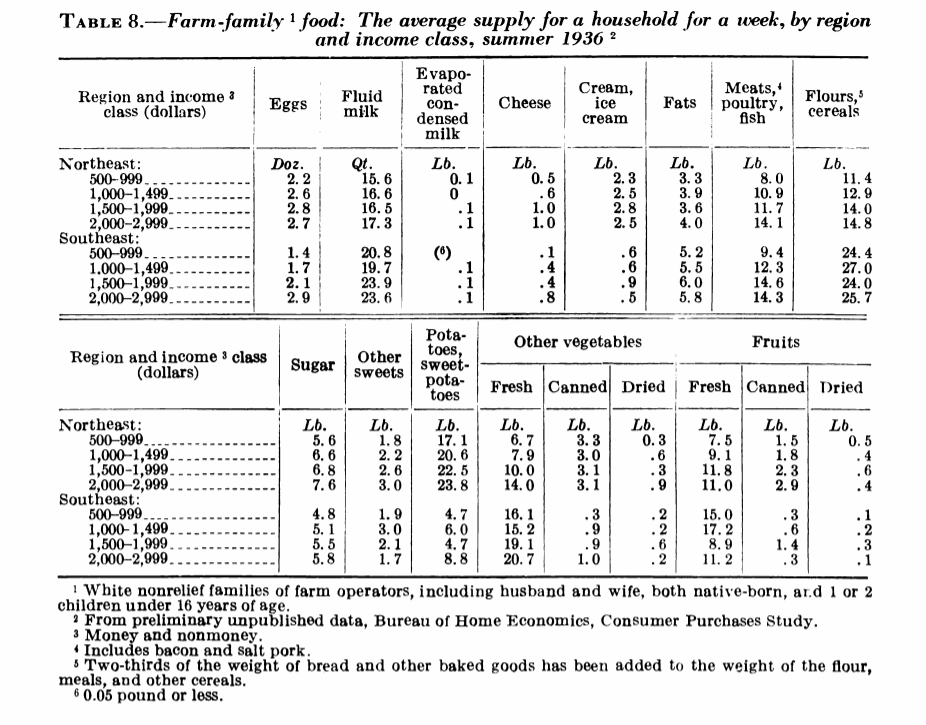
Farm families of the time consumed FAR more than their city counterparts:
How much do we eat now?
According to the CDC, a nutrition-requirement unit eats this much, around 2500 calories between the ages of 20 and 60:4
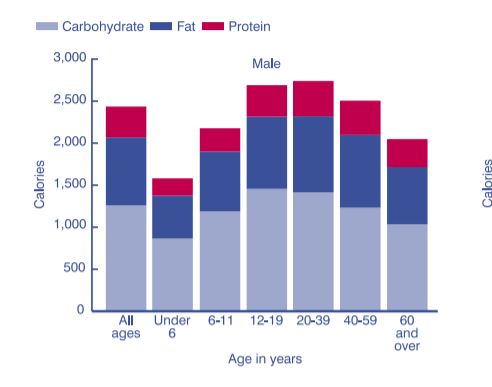
Many have questioned the methodology of the NHANES study but I would stand by the argument that it is unlikely that we eat MORE now than we did in the 1930s.
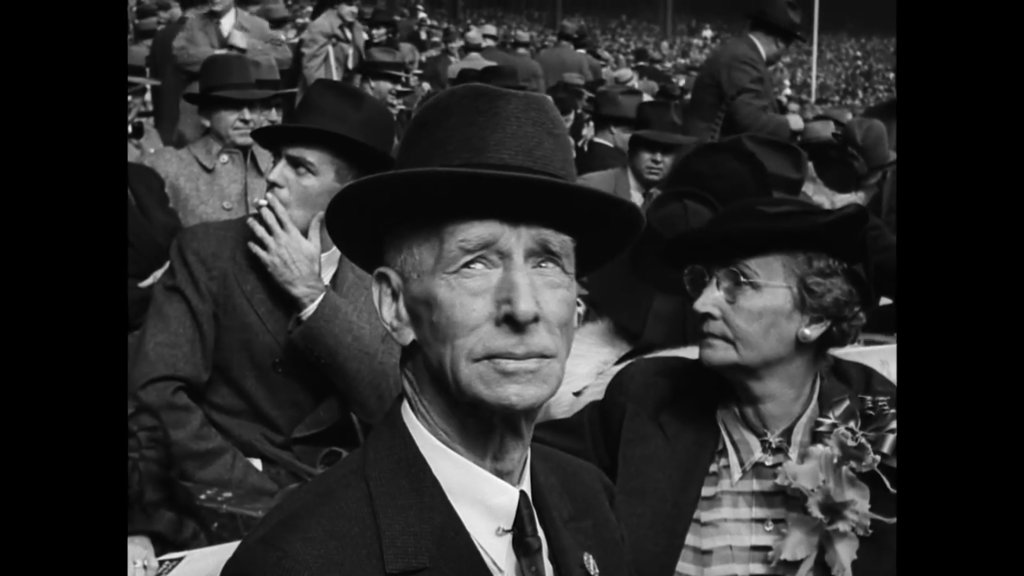
Rich people at a baseball game in 1939!
Maybe rich people were really fat in the 30s? Not from what I can tell. I’m sure there is better data than this, but here are photos from the most expensive seats in Yankee stadium during the 1939 World Series5 – a very expensive ticket!


Read The Article!
Below I’m attaching the entire USDA article from 1939. It’s REALLY worth reading. Geographical differences in the types and amounts of fat consumed, the amount of sugar and white flour, differences between white and black populations. City folk vs. country folk? It’s in there!
Conclusion: leptin was doing it’s job in 1939 in a way that it’s not doing in 2021.
- 1.Shao X, Wang M, Wei X, et al. Peroxisome Proliferator-Activated Receptor-γ: Master Regulator of Adipogenesis and Obesity. CSCR. Published online March 3, 2016:282-289. doi:10.2174/1574888×10666150528144905
- 2.Dulloo AG, Stock MJ, Solinas G, Boss O, Montani J-P, Seydoux J. Leptin directly stimulates thermogenesis in skeletal muscle. FEBS Letters. Published online March 4, 2002:109-113. doi:10.1016/s0014-5793(02)02449-3
- 3.Stiebeling HK, Coons CM. Food And Life. USDA; 1939.
- 4.Intake of Calories and Selected Nutrients for the United States Population, 1999-2000. National Health and Nutrition Examination Survey. Published 2015. https://www.cdc.gov/nchs/data/nhanes/databriefs/calories.pdf
- 5.Weinstein S. 1939 World Series Game One Yankees vs. Reds. YouTube. Published April 29, 2013. https://www.youtube.com/watch?v=VvUMD-20Llo

The subject of the second photo of the 1939 World Series appears to be Philadelphia A’s owner, Connie Mack. A notorious cheap skate, he lived well into his 80s and was long and lean to the end of his life.
Dr. Michael Eades had a talk a couple of years ago where his new theory on obesity stems from the introduction of seed oils into the diet. Like you, he showed photos of gatherings from as far back as 100 years to photos of kids at Woodstock. He wondered in his lecture, how could people back then eat so many potatoes, bread, desserts almost on a nightly basis, consume so much sugar (though not as much as today) yet be relatively lean. He thought — SEED OILS — mom was baking pies and cakes with lard and butter (My grandmother made cakes with sour cream).
Here is the link to Dr. Eades: https://www.youtube.com/watch?v=pIRurLnQ8oo
Yeah, That’s Connie Mack. It says it in the video.
I’ve watched Dr. Eades talk. We are in the same place on this.
Brad – You may be interested in some other perspectives from that period (and earlier) where the primary institutional nutritional concern was malnourishment/underweight, with overweight/obesity a distant second. In particular, the military weight standards are enlightening, with “standard” and minimum weights by height specified during the World Wars, but with little thought given to being overweight, other than statements like “provided that the overweight is not so excessive as to interfere with military training.” This publication covers the history well (at least through 1992 when it was published): https://www.ncbi.nlm.nih.gov/books/NBK235960/ Figure 3-3 is quite interesting. Most striking is the 40+ pound jump from the basically identical 1912 and 1940 standard weights to the 1983 maximum.
Another interesting source is Eugen Sandow’s Life is Movement (https://archive.org/details/b31355870), which discusses at length the limited pool of suitable recruits for the British Army during World War I due to malnourishment and resulting lack of physical conditioning in the general population.
As far as macros and calories go, there’s this USDA publication from 1902: https://digital.library.unt.edu/ark:/67531/metadc6413/m1/1/ The table starting on page 34 describes the diets of a wide variety of populations, including very active folks consuming 4000+ calories and more sedentary people solidly in the 2500-3500 calorie range.
Wow, thanks for the references! Very interesting, I can’t wait to get a chance to read them.
Brad
Cigarettes. Nice discussion nicotine on Peter Attia AMA
Didn’t mom use crisco , fleischmanns, mazola before th 60’s? Why a doubling of LA fro 62 to 1991?
Brad — You may be interested in some other perspectives from that period (and earlier) where the primary institutional nutritional concern was malnourishment/underweight, with overweight/obesity a distant second. In particular, the military weight standards are enlightening, with “standard” and minimum weights by height specified during the World Wars, but with little thought given to being overweight, other than statements like “provided that the overweight is not so excessive as to interfere with military training.” This publication covers the history well (at least to 1992 when it was published): https://www.ncbi.nlm.nih.gov/books/NBK235960/ Figure 3-3 is quite interesting. Most striking is the 40+ pound jump from the basically identical 1912 and 1940 standard weights to the 1983 maximum.
Another interesting source is Eugen Sandow’s Life is Movement (https://archive.org/details/b31355870), which discusses at length the limited pool of suitable recruits for the British Army during World War I due to malnourishment and resulting lack of physical conditioning in the general population.
As far as macros and calories go, there’s this USDA publication from 1902: https://digital.library.unt.edu/ark:/67531/metadc6413/m1/1/ The table starting on page 34 describes the diets of a wide variety of populations, including very active folks consuming 4000+ calories and more sedentary people solidly in the 2500-3500 calorie range.
What I really found interesting in this book was the part that spoke of eating cheaply, that you can find cheaper cuts of meat and it be as nutritious as the expensive cuts. Great stuff!
That mentality still exists today.
She did. But she also still used butter. My household in the 80’s literally didn’t have butter. It wasn’t a thing. Just maragarine. Anyway you want to slice it, the data is clear. Vegetable oil consumption went WAY up between 1960 an 1990. According to FAOSTAT food disappearance data, total veg oil consumption in 1961 was 33g per capita per day. In 1991 it was 66g. So yeah. Double.
Can’t imagine seeing ads for women to gain weight in today’s magazines! These are from 1930-1950. (gotta ignore how insulting they are 🙂
https://www.vintag.es/2019/08/vintage-weight-gain-ads.html
You guys are so good! Thanks for the finds.
Brad
I have a question Brad. If you go from eating a carnivorish diet, with a lot of pork, than by chance start reading your stuff, as well as Tucker Goodrich on Linoleic Acid, and cut that s**t out of your diet to the best of your ability.. Could you be experiencing “withdrawals”, or just physical unwellness for a while, while some of the stored PUFA are trying to leave the body? Could you for a period be just unwell.. tired, joint pains, heart palpitations ++ , I also when from some carbs/sugars, to more or less none. Could it trigger anxiety ? Tnx
PS: if you, or anyone else heard of this, do you by any chance know how long it will take before you start feeling great again?
It sounds like your electrolytes are off due to completely eliminating the carbs. Add back 50 grams of carbs at the end of your last meal of the day and see if there is an improvement. Not everyone can do a zero carb diet.
thanks, I’ll try that
I’m not a huge believer in the idea that eliminating PUFA will somehow cause a mass exodus of your stored PUFA. From what I’ve seen, PUFA is preferentially released and burned anyway. Are at least, it’s always burned in proportion to its storage levels.
Here’s an alternative thought, though. What your burning is a mix of stored fat and dietary fat. If you’ve eliminated dietary PUFA, you might be burning a more saturated mix/generating more ROS. Perhaps that is what your body is adjusting to? Either way, I would think you’ll adapt within weeks? Just a guess.
Brad
You’ll find this interesting:
Early humans may have survived the harsh winters by hibernating
Quote:
“large mammals such as bears do not actually hibernate, because their large bodies cannot lower their core temperature enough. Instead they enter a less deep sleep known as torpor. In such a condition, the energy demands of the human-sized brains of the Sima people would have remained very large, creating an additional survival problem for them during torpor.”
This IS interesting. Someone mentioned something similar about a podcast where it described eskimos as spending the winter in a torpid state. I’ve lost the link, unfortunately.
Brad
It would be interesting if there was data on how much women ate in those times. The majority of women back then maintained a healthy weight, but even before the obesity epidemic there was more pressure on women to stay slim and have an ideal figure. Nowadays, it’s common to see women eating 1200 calories or less, doing regular cardio, but barely loosing weight. I’m sure people were eating more than that in the 1930s, it’s just a question of how much more.
It’s funny you mention that. Someone just posted this link to ads from that time period for how women could GAIN weight to be more attractive:
https://www.vintag.es/2019/08/vintage-weight-gain-ads.html